Integrations are one easy way to get data from external systems into VMware Aria Operations for Applications (formerly known as Tanzu Observability by Wavefront). Use one of the built-in integrations and customize it as needed.
We update our integrations release notes frequently.
Watch a Video
In this video, Jason talks about the different integrations we have, and how you can use them to get your data into the product. You can also watch the video here  . Note that this video was created in 2017 and some of the information in it might have changed. It also uses the 2017 version of the UI.
Try an Integration!
Sign up for a trial version to try our integrations. Detailed setup steps for each integration are in the product UI.
You need to generate the API token in the Operations for Applications UI. It is recommended that you use a service account API token. For more information, see Manage API tokens.
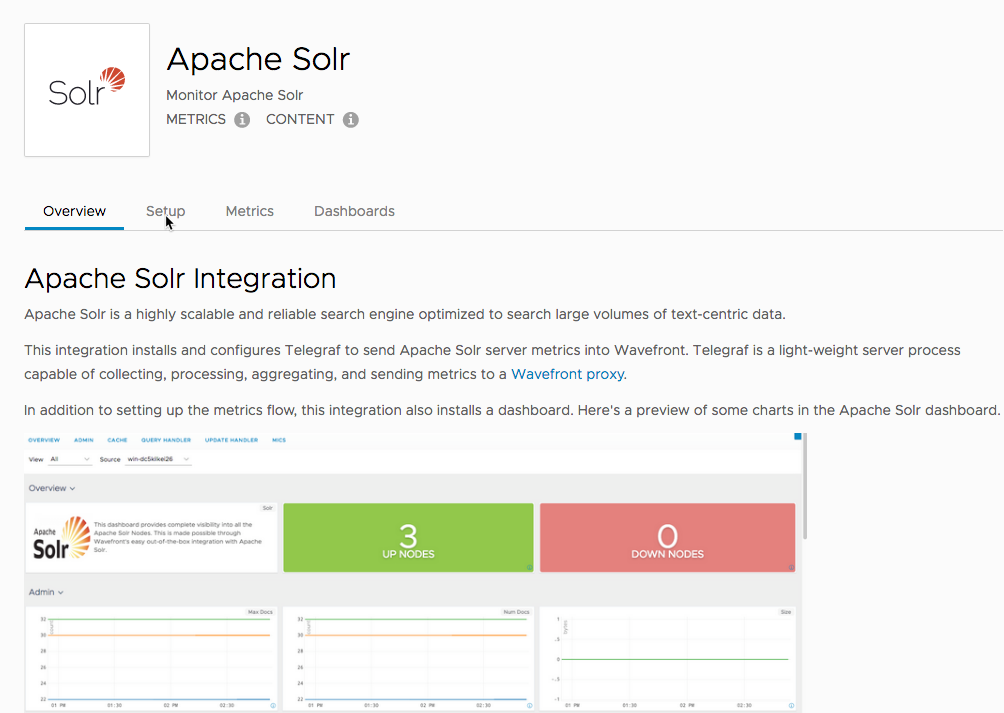
Here’s a sample of what you see when you select one of our integrations:
- The Overview tab explains how the integration works and what’s included, often a sample dashboard with commonly used charts.
- The Setup tab has the instructions for configuring the integration.
- The Metrics and Dashboard tabs are preconfigured to show your metrics after you’ve set up the integration. You can clone and customize our dashboards.
- The Alerts tab is an optional one. It contains a list of preconfigured integration alerts.
Here’s a screenshot that shows the different tabs of the Apache Solr integration.
Note Even if we don’t have an integration for you data source, you can send your data directly to the Wavefront proxy in one of the supported data formats.
Built-In and Custom Integrations
VMware Aria Operations for Applications lets you set up many integrations directly from the product. For other integrations, we give step-by-step instructions – or you can send your data in other ways, for example, using the Telegraf output plug-in.
-
Built-in integrations provide assisted installation and configuration. Many integrations also install a dashboard for you. Access the integration by clicking Integrations on the toolbar and clicking the Setup tab.
-
Customizable built-in integrations provide a built-in integration for the initial connection, with additional customization information in this documentation.
-
Custom integrations provide installation and configuration instructions in this documentation.
This table provides links to the documentation pages for many of the custom and customizable integrations:
| Category | Examples |
|---|---|
| Customizable built-in integrations | AWS Metrics Integration, Amazon Web Services ECS, AWS Lambda Functions, Log Data – FileBeat and TCP |
| Custom integrations - collectd | Apache collectd, Cassandra collectd, MySQL collectd, NGINX collectd, Redis collectd, ZooKeeper collectd |
External (Open-Source) Integrations
Our customers have started to make open-source integrations available on GitHub.
Our first external integration sends AlertSite monitoring results to VMware Aria Operations for Applications and is available at https://github.com/secureworks/AlertSite2Wavefront.
We’re excited about this contribution and hope to see more soon!
Installing and Uninstalling Integration Dashboards
You can install and uninstall the system integration dashboards.
- Click Integrations on the toolbar.
- Click an integration tile.
- Click the Dashboards tab.
- Click [Install | Uninstall] Dashboards.
Cloning and Customizing Dashboards
You cannot modify the system dashboards. Instead, you must clone the dashboards.
- Open an integration dashboard:
- Click Integrations on the toolbar.
- Click an integration tile.
- Click the Dashboards tab.
- Click the dashboard that you want to clone and edit.
- Click the ellipsis icon in the top right corner of the dashboard.
- Select Clone.
- Provide a URL string that’s just the name (e.g.,
mydashboardordashboard-name-clone) and not the URL (e.g.,http://mydashboard). - Customize the clone to suit your needs.
Installing and Uninstalling Integration Alerts
Some integrations contain system alerts. You can preview the system alerts even before setting up an integration by clicking Preview. In Preview mode, you cannot do any customizations to these alerts. You can also install and uninstall the predefined integration alerts to explore them further. After you install the system alerts, you edit some of their settings.
To install the system alerts:
- Click Integrations on the toolbar.
- Click an integration tile.
- Click the Alerts tab.
- Click [Install All| Uninstall All].
Editing and Cloning the Integration Alerts
To edit the targets of the integration alerts, you must have the Alerts permission. If you edit the system integration alerts and then reinstall them, all of the changes that you’ve made are reverted back to their original state.
By default, when integration alerts are installed, you can edit the following alert settings:
- Tags – You can add additional tags, as necessary.
- Alert Condition threshold values – You can edit the threshold values but NOT the operator.
- Recipients – Specify the email address, PagerDuty key, or alert targets that will receive alert notifications
- Runbook, Triage Dashboard(s), and Additional Information settings – Allow you to add runbook URLs and specify other information that can help with alert resolution.
Clone the alert before making any customizations so that you don’t lose your changes.
To clone an integration alert:
- Click Integrations on the toolbar.
- Click an integration tile.
- Click the Alerts tab.
- Click Edit next to the alert that you want to clone. The alert opens in Edit mode.
-
Click the Clone button in the top right corner of the alert.

-
Enter a name of the new alert and click Clone.
The new alert opens in edit mode.
- Customize the clone to suit your needs and click Save.
After you clone an alert, snooze the original system integration alert to avoid running a duplicate version of the alert. For more information about editing alerts, see Manage Alerts.
Integration States
The Integrations page reports integration states depending on two factors:
- Whether metrics ever reported and whether they reported in the last 2 hours or in the last 7 days.
- The state of content installation, such as installed, never installed, or uninstalled.
Supported States
The supported states are:
- Active - integrations whose metrics are reporting and user has installed or uninstalled content.
- Available - integrations whose metrics never reported and content has been never installed or integrations that don’t have metrics.
- Warning - integrations whose metrics never reported and have no installed content.
- Error - integrations whose metrics reported within the last 7 days but have stop reporting for 2 hours and have installed content.
- Pending - integrations whose metrics are yet to start reporting.
- Alias - integrations that are supported by another integration.
You can also filter integrations with the following saved searches:
- New Integrations - integrations that have metrics reporting for at most two hours and have installed content.
- Installed Integrations - integrations in the Active, Warning, or Error state. An integration can be in one of these states even if content has been uninstalled.
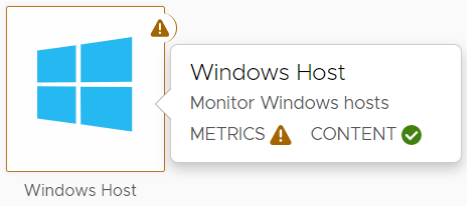
State Indicators
When you hover over an integration, the integration border in the UI changes and you see indicators based on the current state. For example, the following integration is in the Warning state because metrics have stopped reporting in the past month and content is installed.
More Info
- Don’t see the integration you are looking for? Have a look at Set Up Data Ingestion and at Data Format.
- On our VMware Aria Operations for Applications pages we have several blog posts with use cases and background info: