All users in VMware Aria Operations for Applications (formerly known as Tanzu Observability by Wavefront) can examine alerts and drill down to find the problem.
If you are using the Terraform Provider, update to version 3.0.1. Earlier versions are not compatible with the 2022 alert experience.
Create Alert Video
Users with the Alerts permission follow a step-by-step process to create an alert. Watch this 90 second video. Note that this video was created in 2021 and some of the information in it might have changed. It also uses the 2021 version of the UI.
You can also watch the video here  .
.
Create Alert Tutorial
This tutorial creates an alert that allows you to specify the severity for each threshold. For example, you can:
- Send an alert email of type Info to a group of engineers when a certain value is close to the SLO (e.g. 90% of budgeted CPU)
- Send an alert Slack message of type Severe to engineers and engineering managers when the value has crossed that threshold (e.g. 95% of budgeted CPU).
Before you begin, ensure that you have the information for the required fields:
- Alert data. For example, CPU of all production clusters. Be as specific as possible to speed up query execution.
- Alert condition and associated severity. For example, it could be INFO severity if CPU of at least 1 cluster is at 90% for 5 minutes, but SEVERE if CPU of 75% of all clusters is at 90%.
-
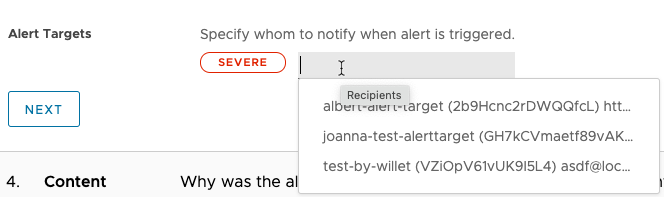
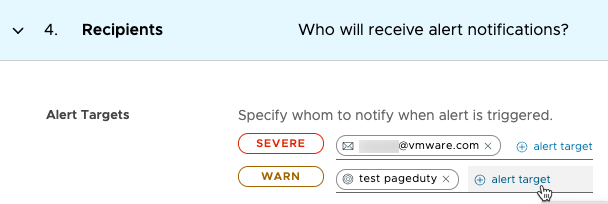
Recipients. For each severity, you can specify an email, Slack notification, or one or more alert targets to notify when the alert changes state. When the alert changes state, each target that meets the condition is notified with the specified severity.
Tip: Alert targets subscribe to all notifications at their severity and above. For example, a recipient associated with INFO severity receives all notifications for INFO, SMOKE, WARN, and SEVERE. You cannot associate an alert target with more than one severity.
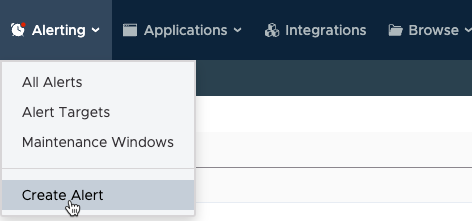
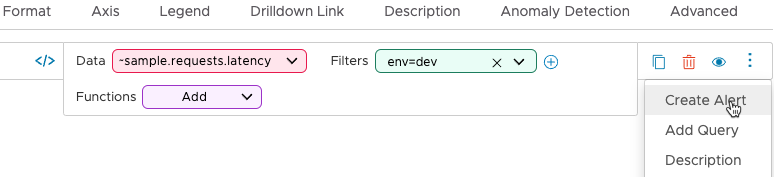
Step 0: Start Alert Creation
To start alert creation, do one of the following:
|
 |
|
 |
Do you see metrics alerts and logs alerts?
You can create logs alerts using the logs data that you sent. For detail, see Manage Alerts for Logs.- You need the Logs permission to view the logs alerts.
- You need the Alerts and Logs permissions to create and manage logs alerts.
Step 1a: Specify the Data to Watch and Alert On
In the Data section, specify the data that you want to monitor, optionally customize the chart, and click Next. You have many options:
|
 |
Step 1b: Customize the Chart (Optional)
| By default, each alert includes a line chart with a two hour time window. You can modify the chart type, format, axis, and some other aspects of the chart. See the Chart Reference for background. Important: The customizations for alert charts are more limited than the customizations for charts in dashboards. |
 |
Step 2: Specify Thresholds and Severities
|
1. In the Conditions section, specify thresholds for the alert. The threshold becomes visible in the chart. You can alert when the query result is greater than or less than the specified threshold. Specify at least 1 threshold. Note: If your Data query is a Boolean expression that includes a comparison operator, you can specify only one severity. |

|
2. Click Test Condition to check if the alert would have fired in the current time window. Examine the test result, shown above the chart.
 Tip: Test Condition looks backwards, and does not always match the actual alert firing in the future. See the FAQ below.
 |
|
3. Optionally, fine-tune and test the condition.
|
 |
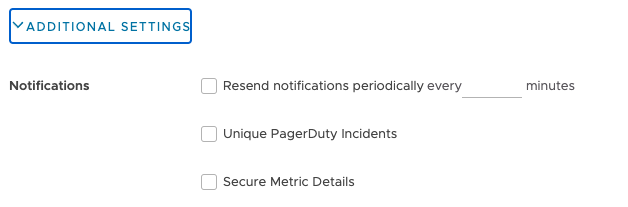
4. For special cases, expand Additional Settings to also specify the following settings. The default is often best.
|
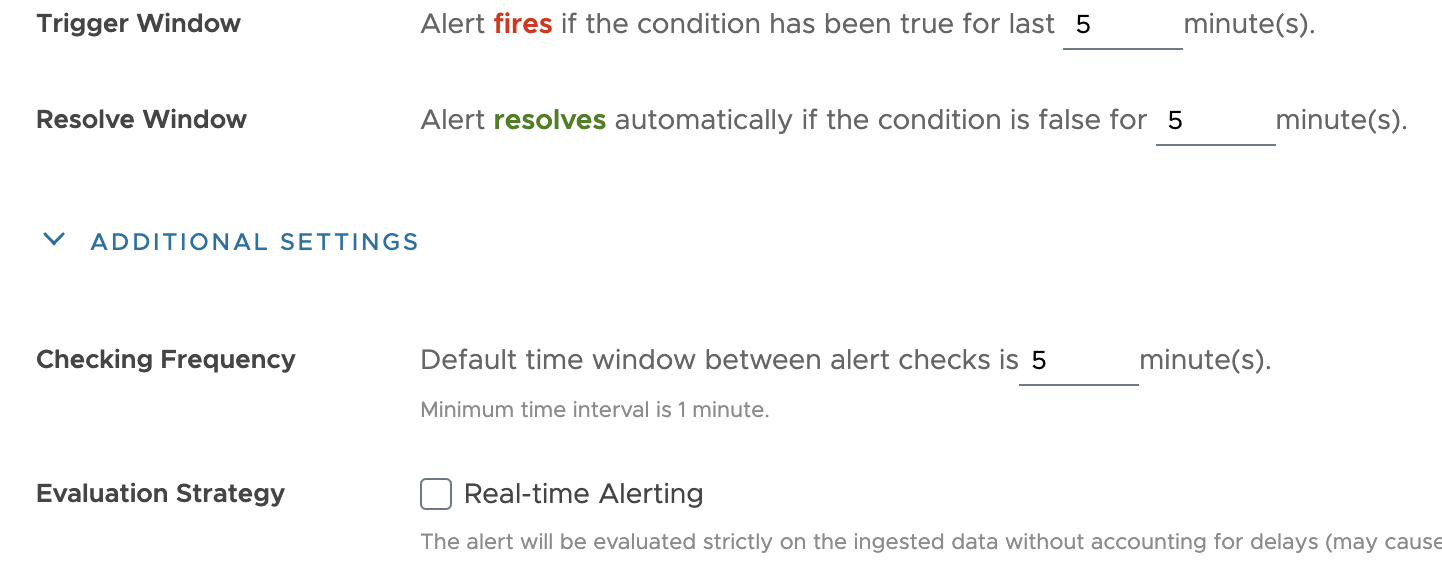 |
Step 3: Specify Recipients
Alert recipients receive notifications when the alert changes state. For each severity, you can:
|
 |
Step 4 (Optional): Help Alert Recipients Resolve the Alert
If you already have information that helps recipients find the causes for the alert, specify them in the Contents section:
|
 |
Click Additional Settings to further customize the notifications for special cases.
|
|
Click Preview Notification for a preview of the notification that users will see.
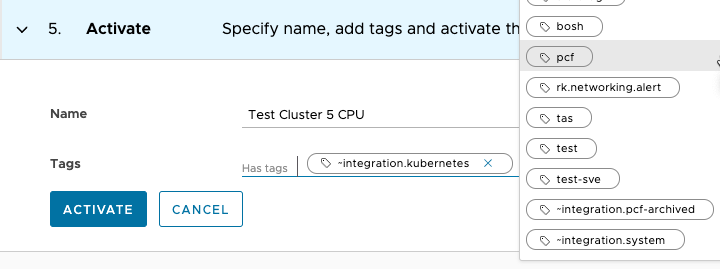
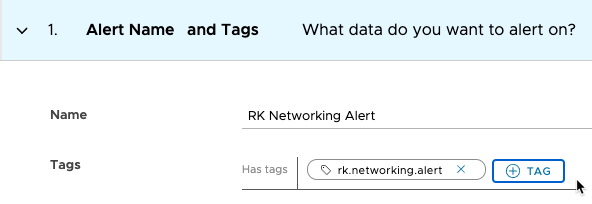
Step 5: Name and Activate the Alert
As a final step, you name the alert, optionally add alert tags, and activate the alert.
|
 |
Alert FAQs
Here are some frequently asked questions about alerts.
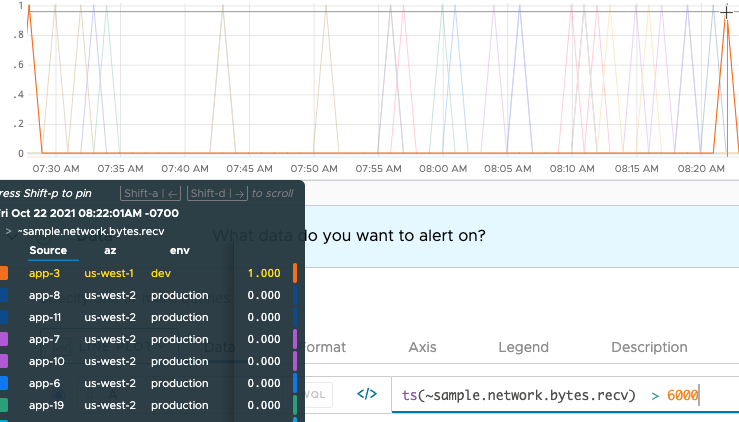
Why Can I Specify Only 1 Severity?
If your data query follows the format <expression> <comparisonOperator> <constant>, for example myCPU < 45000, the query itself already includes the condition.In the example screenshot on the right, the threshold is 6000. Notice how the hover text shows either 0 or 1 for the different time series. |
 |
| Because the threshold is predefined, you can select only 1 severity. All notifications will go to the same set of recipients with that severity. |  |
If your query does NOT follow the <expression> <comparisonOperator> <constant> pattern, you can specify different thresholds and different severities.
Who Gets Notified When the Alert Changes State?
We send alert notifications when the alert changes state.
- An alert with a query that follows the pattern
<expression> <comparisonOperator> <constant>sends a notification with the specified severity to all specified targets. This page calls this type of query Boolean query. - A multi-threshold alert supports multiple severities and a different target for each severity. When the alert changes state, targets for conditions that meet the severity threshold are notified. Lower severity targets always receive notifications for all higher severities.
For example, an alert fires when a metric stays at a value that indicates a problem for the specified amount of time. But you might also want to be notified when the alert is resolved or when the alert is snoozed. The alert target gives fine-grained control over which state changes trigger a notification.
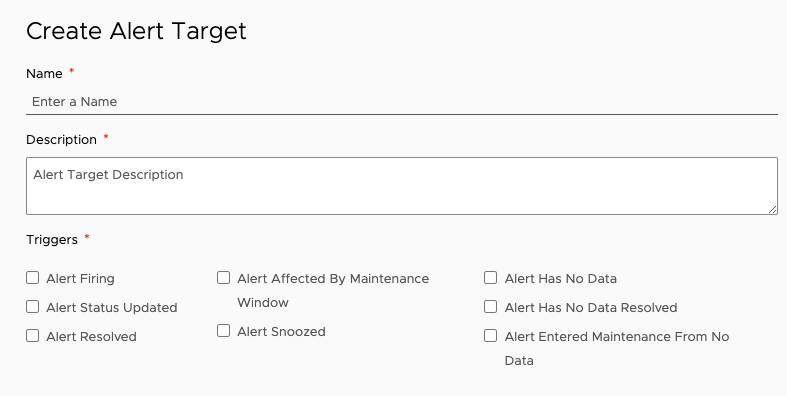
What’s an Alert Target?
Each alert is associated with one or more recipients: an email address, PagerDuty key, or alert target.
When the alert changes state, the recipients are notified. Customize which state changes trigger a notification:
- When you create the alert target
- When you edit an alert target.
The maximum number of email alert targets is:
- 10 for alerts with Boolean queries that follow the pattern
<expression> <comparisonOperator> <constant>. - 10 per severity for multi-threshold alerts.
If you exceed the number, you receive a message like the following:
{"status":{"result":"ERROR","message":"Invalid notification specified: null","code":400}}
My Alert Fires with Test Condition, But Not In Production
Test Condition is useful in fine-tuning an alert, but doesn’t always match what happens in production.
For example:
- If data comes in late, Test Condition won't match the actual alert firing. Data are visible looking back, but might not be there in real time.
- If data are meeting the alert condition for the "condition is true for x mins" amount of time, the actual alert might not fire because the alert check, determined by the alert check interval, happens too soon or too late.
For both cases, test condition shows that the condition was met, but the actual alert might not fire.
How Do I Pass Values to Triage Dashboards?
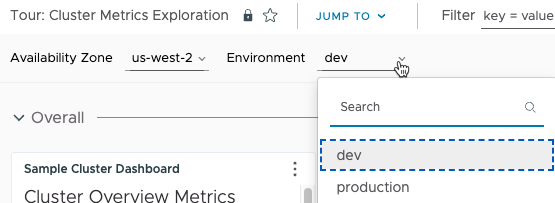
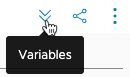
The Content section allows you to specify one or more triage dashboards. For each dashboard, you can preset one or more dashboard variables so that the user sees what they’re interested in when they go to the triage dashboard. Here’s an example that uses the predefined Cluster Metrics Exploration dashboard that’s part of the Tour Pro integration as the target dashboard.
|
 |
Edit Alerts
Users with the Alerts permission can change an alert at any time. The options are similar to what you see when you create an alert, but you can quickly focus on the things that you want to change.
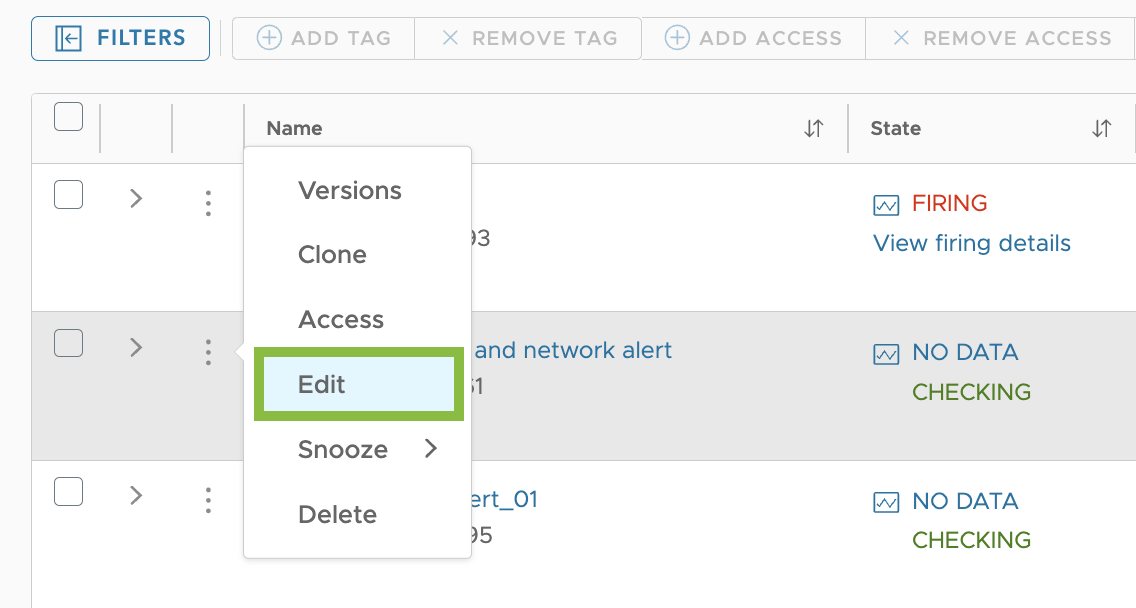
Start the Alert Edit
|
 |
|
 |
Change the Alert Properties
You can change the alert properties when you edit the alert.
|
Alert Name and Tags In this section:
|
 |
|
Data In this section:
|
 |
|
Conditions In this section, you can fine-tune the alert condition and test the condition.
|
 |
|
Recipients In this section, you can view, change, or add recipients of alert notifications.
|
 |
|
Content In this section, you can add runbook URLs and specify other information that can help with alert resolution.
|
 |
Save Your Changes
Click Save in the top right to save your changes.
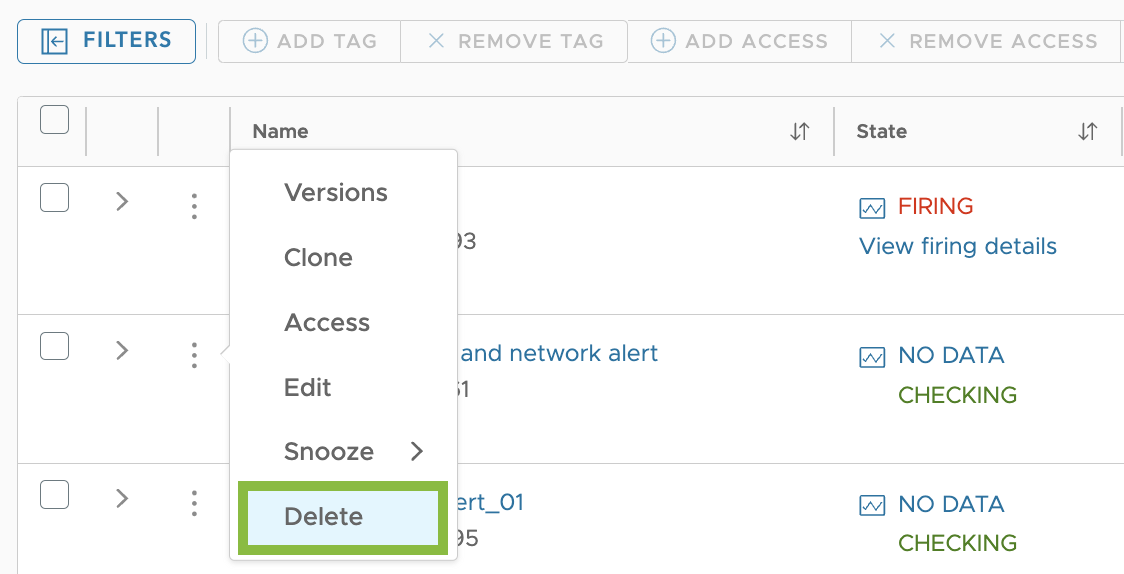
Delete an Alert
You delete an alert from the Alerts Browser page. Only users with the Alerts permission can delete an alert.
|
 |
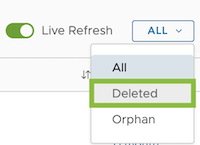
Restore a Deleted Alert
You can restore an alert from the trash if it was deleted less than 30 days ago or if it wasn’t permanently deleted. You restore deleted alerts from the Alerts Browser page. Only users with the Alerts permission can restore a deleted alert.
|
 |
Restore an Alert Version
Each time you save an alert, you create an alert version. Up to 100 versions are supported.
|
 |
Do More!
- Look at the Alerts FAQ.
- Learn about alert states and life-cycle.
- The Alert Viewer Tutorial shows how to examine a single alert.
- The Alerts Browser Tutorial explains how you can examine and manage all alerts in your environment.
-
Use ACLs to limit or share access to an individual alert.
- See the KB article Migrating Objects or Data Between Environments if your company has several Operations for Applications service instances.