Point tags are key-value pairs (strings) that are associated with a point. Point tags provide additional context for your data and allow you to fine-tune your queries so that the output shows just what you need.
Point Tag Basics
Point tags offer a powerful way of labeling data so that you can slice and dice it in almost any way you can imagine. For example, you can use point tags to label a point’s data center, version, etc., and can then group by data center or version.
Many of our cloud integrations generate point tags automatically to help you filter metrics. You add point tags explicitly using Wavefront proxy preprocessor rules.
Point Tag Maximum
VMware Aria Operations for Applications (formerly known as Tanzu Observability by Wavefront) supports up 20 point tags per time series. A larger number of point tags does not improve the user experience and can lead to performance problems.
Point Tag Example
Our ~sample metrics, included in each product instance, have two point tags, env and az. Each point tag has two values, and you can filter to show one or the other set of time series. Below, the time series with env=dev are shown in shades of blue, and the time series with env=production are shown in shades of green.
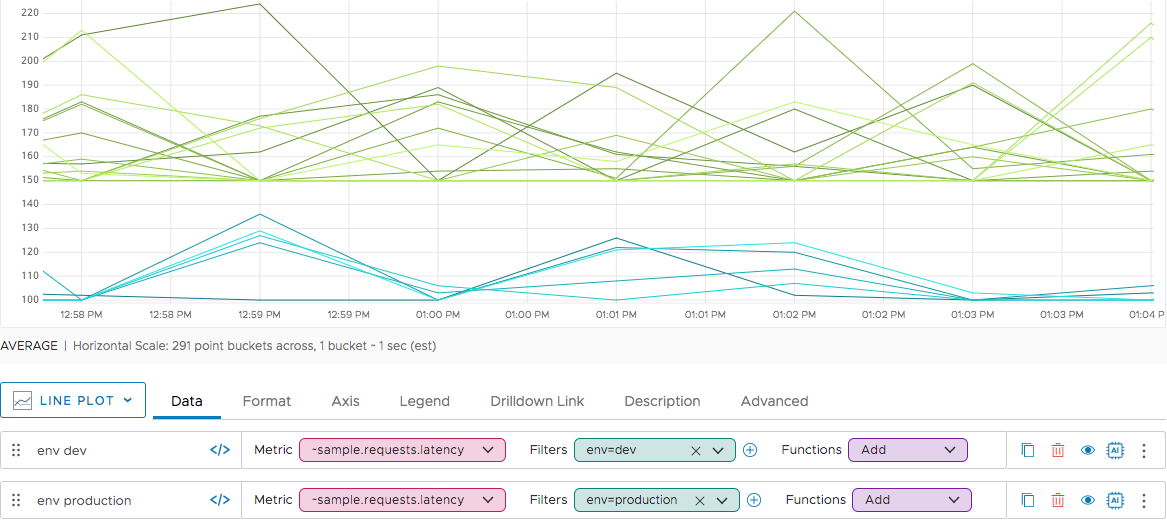
You can filter further, either by specifying another point tag or by combining a point tag filter with a source filter.

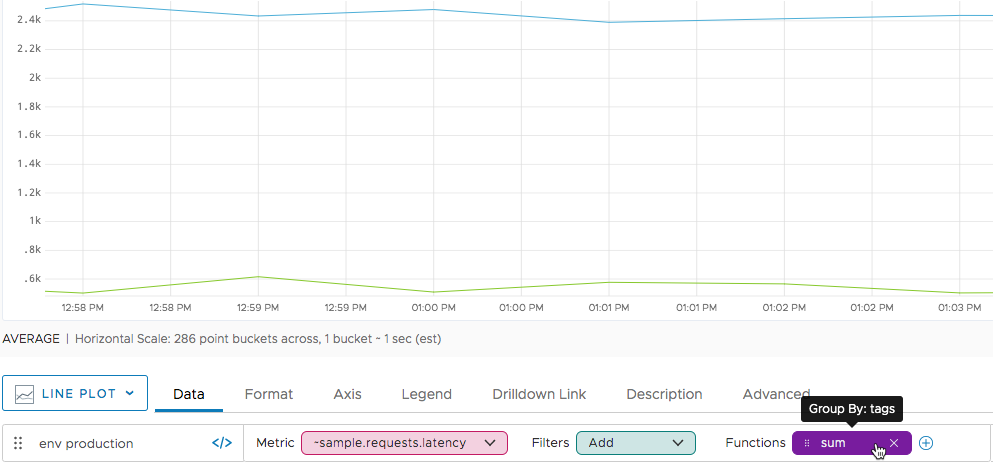
Finally, instead of filtering, you can use grouping, for example, in conjunction with an aggregation function. The sample data are a bit unusual because all time series with env=production are also tagged with az=us-west2. In an actual data set, we would expect 4 lines as a result of this query, two that sum for each environment and two that sum for each availability zone.
zone and ZONE, when you use an aggregation function and apply grouping, we will consider zone and ZONE as separate tags. Best Practices for Point Tags
To avoid performance issues, follow best practices.
Enclose Point Tag Values in Double Quotes
Double quotes are required if the point tag value includes certain characters such as spaces but are recommended in all cases. For example, use "my test" instead of my test.
Don’t Use More Than 20 Point Tag Keys
Each point tag key (e.g., env or az) can be associated with a high number of values, but you can’t have more than 20. You’ll find that working with your data shape to fall inside this limit has the side benefit of making it much easier to understand what you see.
Watch the Number of Time Series
Keep the number of distinct time series per metric and host to under 1000. Whether a time series is distinct depends on the combination of the point tag keys and the point tag values.
For example, assume a metric cpu.idle and a host web1. If you use that metric and host with the point tags env=prod and datacenter=atl, a new time series results. If you use env=dev and datacenter=atl, another distinct time series results.
Don’t Use Point Tags for Highly Variable Data
Using point tags to store highly variable data such as timestamps, login emails, or web session IDs will eventually cause performance issues when your data are queried. That is also true if you specify a time that results in many time series being retrieved. For example timestamp=<now> or even monthofyear=11 can exceed the limit. In contrast, dayofweek=monday or monthofyear=jan are acceptable.
Don’t Use Point Tags with OR Operators
When you use point tags with an OR operator, The query engine stops executing the query if the first of the OR-ed point tags fails. This improves efficiency but can lead to incorrect results. Use collect() with your query instead, for example, collect(ts(metric, my_tag="tag1"), ts(metric, my_tag="tag2")) .
More Info
- See Series Matching for info on series matching with point tags, and about the
byconstruct. - See Combining Time Series With join() for info on using
join(), for example, to combine the data points to form a new synthetic time series with point tags from one or both input series.