VMware Aria Operations for Applications (formerly known as Tanzu Observability by Wavefront) supports moving time window functions for calculating continuous aggregation over a sliding time window. Moving time window functions are useful if, for example, you want to calculate the moving average over the past 24 hours.
But if you want to look at the daily average for each day, you have to create fixed-size time window. This page explains how use moving and fixed-sized time windows.
Calculating Continuous Aggregation with Moving Window Functions
The WQL moving window time functions allow you to calculate continuous aggregation over sliding time windows. WQL includes functions for creating moving windows on various aggregation such as msum(), mavg(), mmedian(), mcount(), etc. These functions create continuous moving or sliding windows which can be useful for looking at moving trends.
Recalculation happens at different times for discrete and for continuous time series:
- For discrete time series, the moving windows recalculation is done every second.
- For continuous time series, the recalculation is done for every bucketing interval. For example, if you have a 30 second bucketing interval, then recalculation happens every 30 seconds.
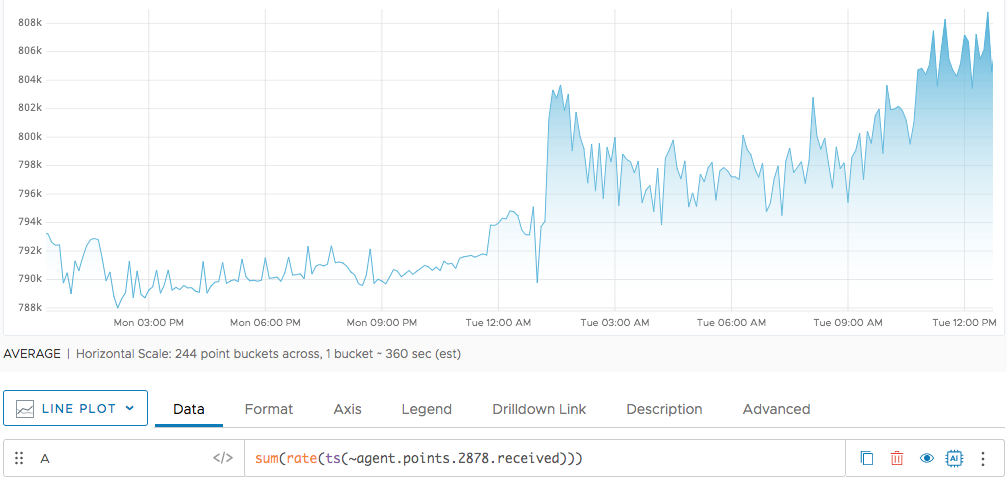
For example, the chart below shows the 24-hour moving average of the points received from the following queries:
| Rate | sum(rate(ts(~proxy.points.2878.received))) |
| Moving avg | mavg(24h, ${rate}) |
The following chart shows the resulting continuous moving average over the past 24 hours.
The moving average shows, at any point in time, the average based on the values of the last 24 hours. But if you want to only look at the daily average for each day, and display that average, you have to:
- Create fixed-size time windows
- Record your metrics in these windows. We show some examples at the bottom of this page.
These windows are commonly referred as tumbling windows. Tumbling windows are a series of fixed size, non-overlapping, and contiguous time intervals.
How Moving Windows Are Different From Tumbling Windows
The following diagrams compare moving and tumbling windows.
Moving Windows
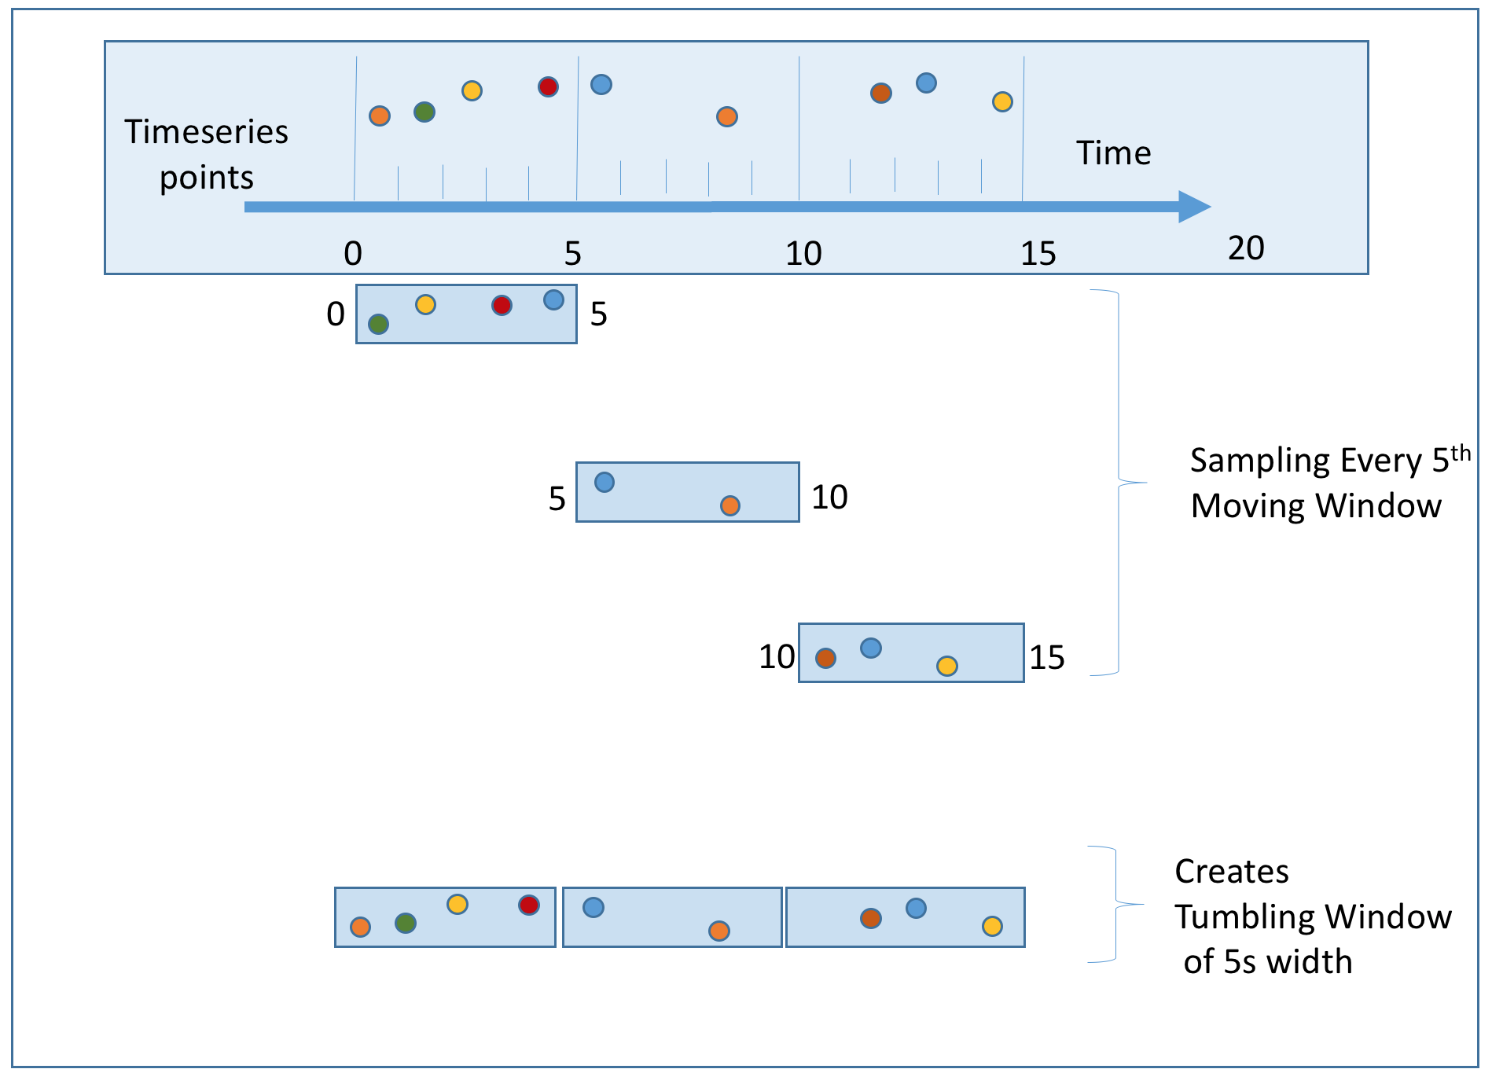
The following diagram illustrates how a series of points is mapped into 5-second moving windows.

The moving window slides ahead one second at a time. New points are added at the front and the older points become invisible as the window moves ahead. The moving windows overlap.
Tumbling Windows
Tumbling windows are fixed windows that do not overlap–the set of points is exclusive for each window, as shown in the diagram below:

You can also find the three tumbling windows in the sequence of moving windows. Every 5th moving window forms this 5-second tumbling window. To create tumbling window of n duration (5 seconds in this example) you can sample every nth moving window (5th window), sliding ahead in the same unit of duration (seconds in this example). You can see that in the following diagram:
Tumbling Window Examples
There are several common use cases for tumbling windows.
Display Daily Average
We can use tumbling windows to get the average daily rate.
We use the hour() function to sample the average every day at midnight. This results in the average for 24 hours, and we can display this average across the day using the missing data function next().
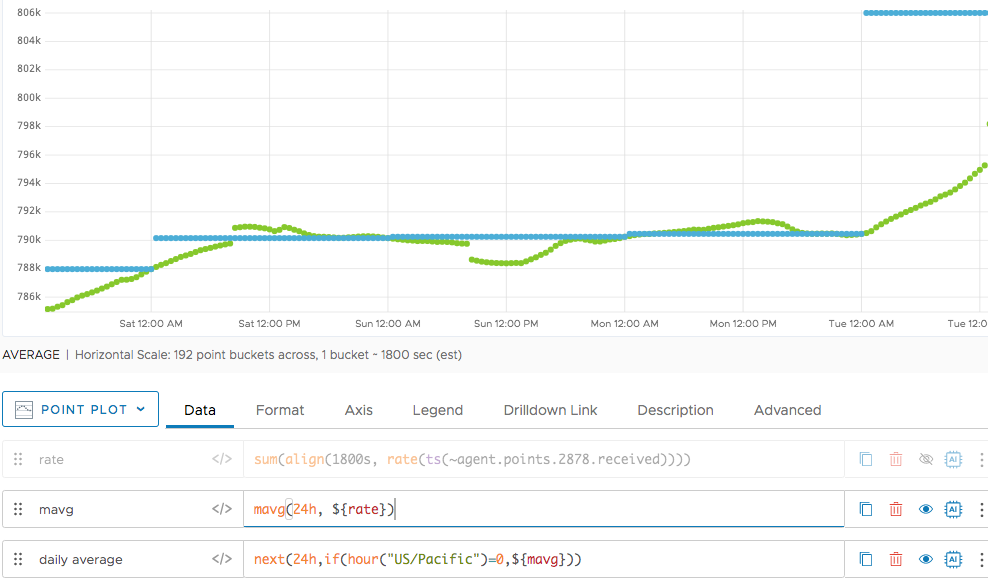
In the chart below, we show the data point sampled at midnight. the green circles show the sampled data. We use next() to display the information for the entire day, as in the following queries. The corresponding chart is immediately below.
| Rate | sum(rate(ts(~proxy.points.2878.received))) |
| Moving avg | mavg(24h, ${rate}) |
| Sampled at midnight | if (hour("US/Pacific") = 0,${mavg}) |

Finally, we can display the daily average like this:
| Daily avg | next(24h,if(hour("US/Pacific")=0,${mavg}) |
Get a 50th Percentile of Each 5-minute Bucket
The following examples show how you can cover any moving function to a fixed or tumbling window by correctly sampling the moving window. You can use time functions the align() function, or both.
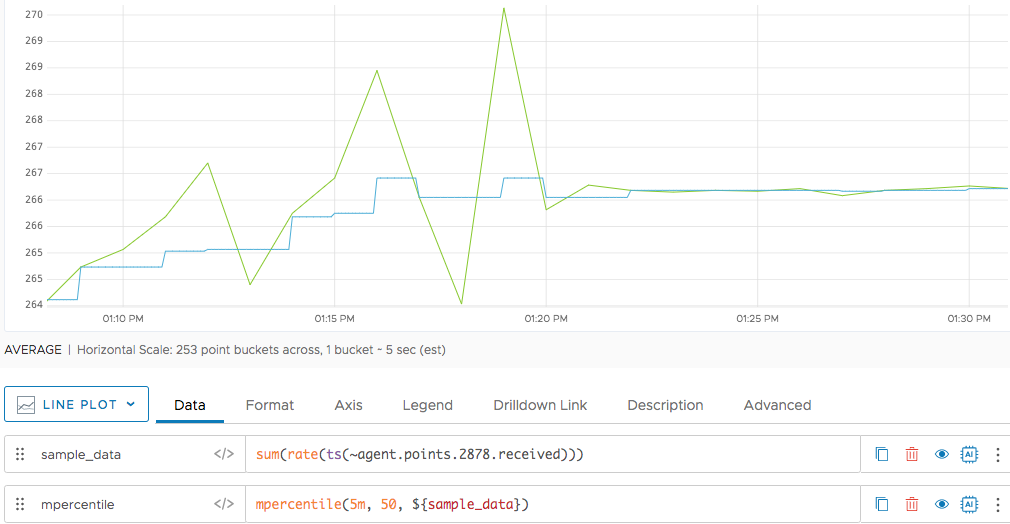
In the following chart, sample data is being reported every 1 minute.
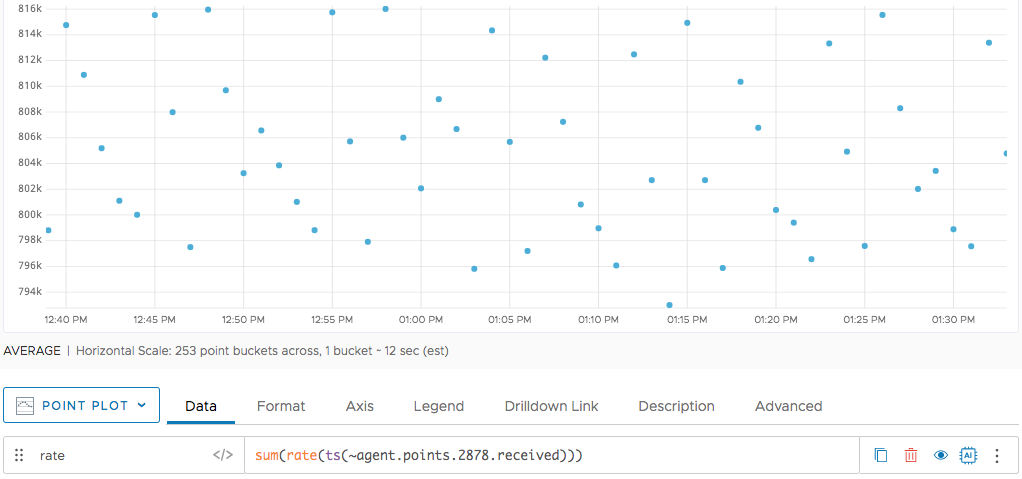
For the same time series, we show a 5-minute moving percentile. The result is the 50th percentile point in the last 5 minutes. We display this point at every minute interval.
If you want to find a 50th percentile of points in fixed 5-minute window, you can use align(5m,...) to sample, followed by next() to display the 50th percentile for the entire 5-minute window. The example uses align() instead of a time function. The screenshot shows all 3 functions.
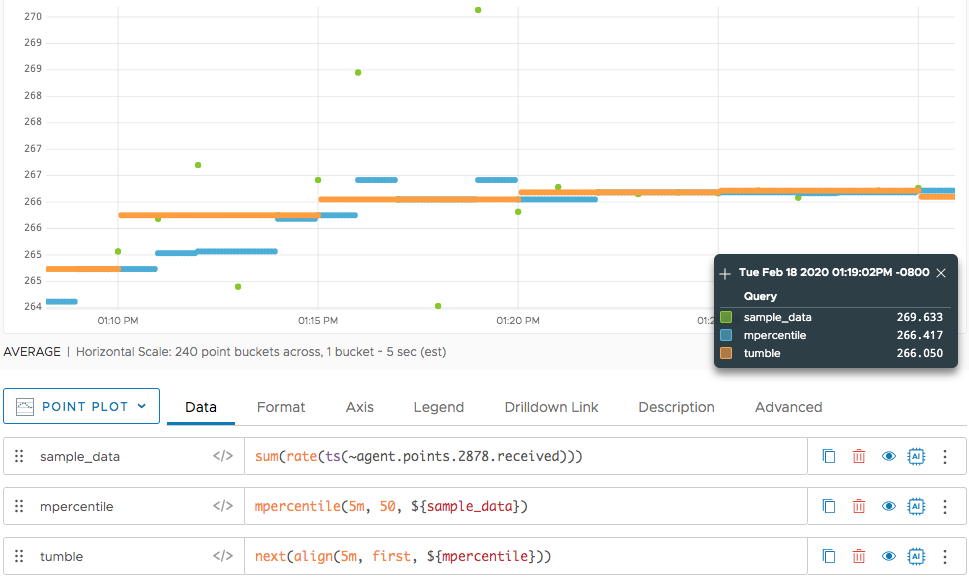
This example plots the raw data overlaid with the 5-minute tumbling window for the 50th percentile. The orange line is the 50th percentile of points in every 5-minute fixed window. You can see how it coincides with the middle-valued point in that time interval.