VMware Tanzu Application Service, previously known as Pivotal Cloud Foundry, is a popular platform for building cloud-native applications.
VMware Aria Operations for Applications (formerly known as Tanzu Observability by Wavefront) is a cloud-hosted service for full-featured observability. When you Tanzu Application Service to send data to the Wavefront proxy, you can take advantage of preconfigured dashboards, clone and customize dashboards, and more.
Product Snapshot
| Version, Release Date | v4.1, May 2022 |
| Compatible Ops Manager versions | v2.10 and later |
| Compatible Tanzu Application Service versions | v2.11 and later |
| IaaS support | AWS, Azure, GCP, OpenStack, and vSphere |
Videos
Watch these videos to get started. Note that the videos were created in 2022 and some of the information in them might have changed. They also use the 2022 version of the UI.
| TAS Monitoring and Alerting |
This 60-second video gives an overview of the architecture, installation process, and benefits of the integration for Tanzu Application Service. You can also watch the video in this playlist here |
| Integrating TAS: How to Get Started |
This video is a complete walk-through of the steps required to get your data flowing from Tanzu Application Service to Tanzu Observability. You learn how to set up the nozzle in Ops Manager, how to get data flowing, and how you can view your data in preconfigured Tanzu Observability dashboards. You can also watch the video in the Tanzu Observability Integrations playlist here |
Process Overview
We’ve streamlined the getting started process so it involves a few simple steps – some are performed in Tanzu Ops Manager, and some in the Wavefront GUI.

- Download the Tanzu Observability by Wavefront nozzle file from the Tanzu Network
- In Tanzu Ops Manager, install, configure, and deploy the nozzle. At a minimum:
-
In the Wavefront Proxy Config section, specify the Operations for Applications instance, authentication credentials, and a user-friendly host name.

-
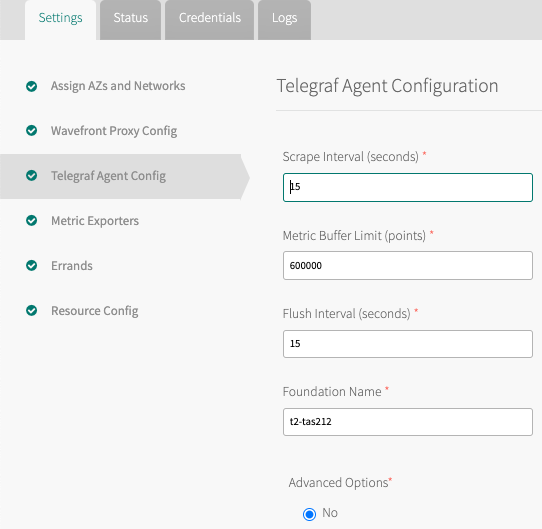
In the Telegraf Agent Config section, specify the Foundation name.
See Ops Manager: Install, Configure, and Deploy the Nozzle and Tanzu Application Service to Tanzu Observability FAQs After you complete nozzle deployment, metrics are flowing from Tanzu Application Service to the Wavefront proxy and from there to your Wavefront instance. See Data Flow below.
-
- Log in to your Wavefront instance and confirm that metrics are flowing:
- Click Integrations in the toolbar, search for Tanzu Application Service, and select the integration.
- Click the Metrics tab and confirm metrics are flowing.
- With the integration selected, click the Dashboards tab.
- Select from the set of predefined dashboards, which are modeled on the corresponding Healthwatch dashboards but have additional options. For example, you can examine multiple foundations from one dashboard.
- Explore one or two dashboards. Examine Data with Dashboards and Charts has an overview and includes a video.
- As appropriate, clone any of the existing dashboards to add charts, modify queries, and more. See Create, Customize, and Optimize Dashboards and Create and Customize Charts
Architecture and Data Flow
Here’s an overview of the flow of data from the Tanzu Application Service Firehose through the nozzle to the Wavefront service. The nozzle consists of these main components:
- Healthwatch Exporters: Exporters are deployed as VMs.
- Telegraf: An open source, lightweight server process for collecting, processing, and aggregating metrics.
- Wavefront Proxy: Ingests metrics and forwards them to the Wavefront service in a secure, fast, and reliable manner
Here’s the data pipeline:
- The Healthwatch Exporter VMs stream metrics from the Tanzu Application Service Firehose. The tile creates a VM for each Healthwatch exporter, a VM for Telegraf, and a VM for the Wavefront proxy.
- Telegraf scrapes the VMs at a predefined interval, and converts them to Wavefront data format. Telegraf uses a built-in plugin. It uses the Wavefront Go SDK to convert the data.
- Next, Telegraf sends the data to the Wavefront proxy.
- The proxy send the metrics to the Wavefront service.
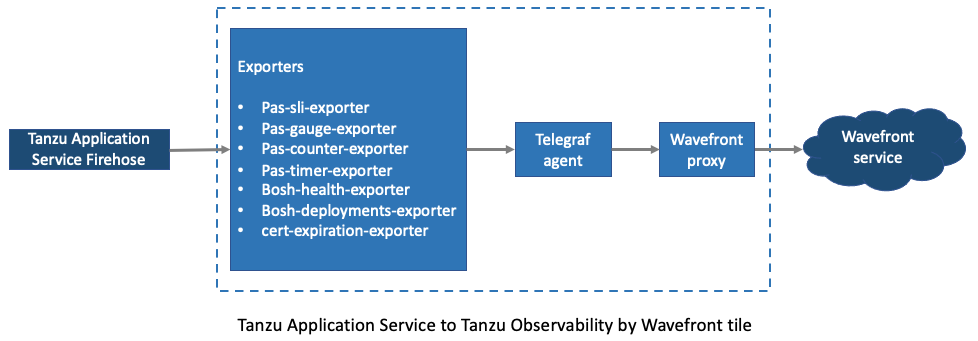
Tanzu Application Service to Tanzu Observability FAQs
In this section, we have some answers to frequently asked questions.
How Can I Change the Scrape Interval?
By default, the scrape interval is set to 15 seconds, but you can set up your environment to check more frequently:
- In Ops Manager, click Telegraf Agent Config.
- Set the Scrape Interval (seconds) field and click Save.
How Can I Send TAS Data via a Proxy That Is Deployed Outside the Tile?
Some customers have a central monitoring/observability team that requires that all data to be sent via a specific set of production proxies. Those proxies are used to filter or alter data before they are sent to the Wavefront service.
You can set up your environment to use production proxies as follows:
- In Ops Manager, click Telegraf Agent Config.
- In Advanced Options, select Yes.
- In the Custom Proxy URL field, provide a proxy URL or IP in the Custom Proxy URL. This could also be load balancer URL if the external proxies are behind a load balancer.
- (Optional) In the Proxy Port field, provide a custom proxy port (Default is 2878).
- Click Save.
How Can I Customize Metrics Ingestion per Component?
If you don’t want to monitor some of your TAS platform metrics, you can choose not to send them. If those metrics are monitored with any out-of-the-box or custom dashboards, they show up as No Data.
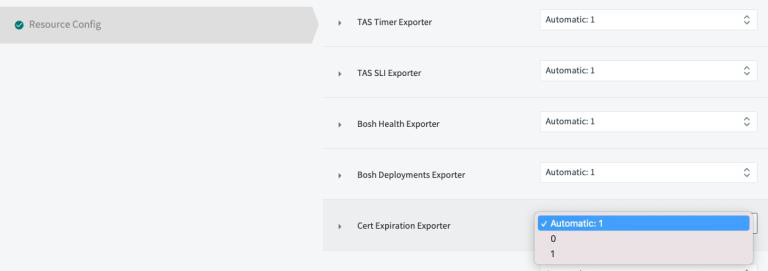
For example, if you don’t want to ingest certificate expiration metrics, then you can remove the VM instance that is assigned to the Cert Expiration Exporter by default. All the metrics that this exporter scrapes will not get ingested.
- In Ops Manager, click Resource Config.
-
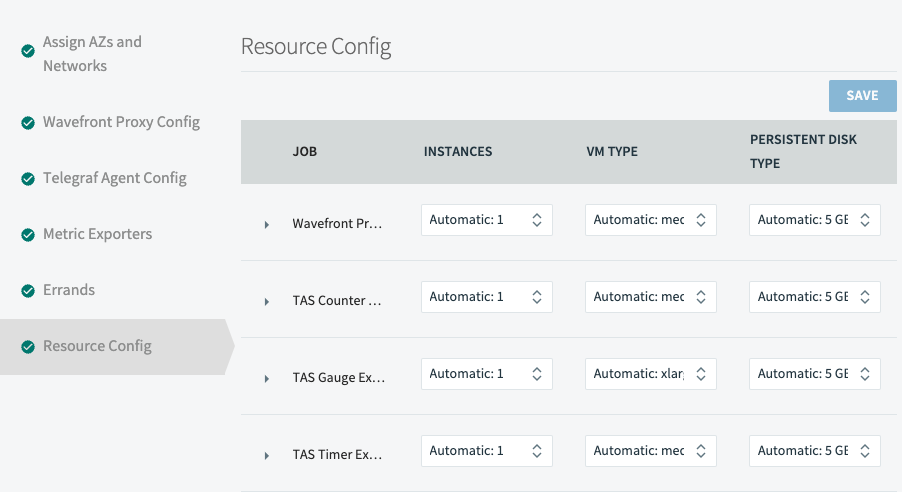
Find the exporter for which you don’t want to emit metrics, set it to 0, and click Save.
The screenshot below shows how to do this.
How Can I Set Up a Metrics Filter?
If you want to consume only a subset of your metrics, you can use an allow list or block list.
You can specify the filter as follows:
- In Ops Manager, click Wavefront Proxy Config.
- Scroll down to Filter metrics by metric name, and select whether you want to use an allow list or a block list.
-
Enter one or more regular expression patterns for your selected list.
Each pattern must begin and end with a slash (/) and be on its own line.
How Can I Further Customize Proxy Behavior?
The Wavefront proxy allows you to control many aspects of your ingestion pipeline with configuration properties and preprocessor rules.
- Configuration file: The proxy processes data according to a configuration file. You can modify configuration properties – for example, to create
blocklist andallowlist regex patterns, specify information about certain data formats, and much more. See Configuring Wavefront Proxies. - Preprocessor Rules: Starting with proxy version 4.1, the Wavefront proxy includes a preprocessor that applies user-defined rules before data is sent to the Wavefront service. You can use preprocessor rules to correct certain data quality issues when you can’t fix the problem at the emitting source. See Configuring Wavefront Proxy Preprocessor Rules.
You can specify custom elements as follows:
- In Ops Manager, click Wavefront Proxy Config.
- Under Custom Proxy Config, click Custom.
- Make your changes and click Save.
Things Aren’t Working. What Can I Do?
Ensure that your environment meet requirements on the Ops Manager side and on the Tanzu Observability side.
- Ops Manager Requirements
VMware Tanzu Observability by Wavefront nozzle has the following requirements:
- Read-only access to the Doppler Firehose and Cloud Controller.
- Access to an Operations for Applications instance.
- Authentication credentials.
- Tanzu Observability by Wavefront Requirements
To set up the Tanzu Application Service integration on your Operations for Applications instance, you must have:
- Access to an Operations for Applications instance.
- At a minimum, Integrations permission on that Operations for Applications instance.
- This version of the Tanzu Observability by Wavefront nozzle is compatible with Wavefront proxy version 10.14 and later.
See Tanzu Observability and TAS Troubleshooting for more.
Process Details
This section explains each step in the flow in detail.
Prerequisites
- You must have a Tanzu Network account to configure the Tanzu Observability Nozzle in Ops Manager.
- You must have login credentials for an Operations for Applications instance to configure the integration.
- Ensure that the root certificate for Ops Manager is included in data coming from Tanzu Application Service. See the No Data Flowing and Certificate Error troubleshooting section.
Step 1: Download the Nozzle File
Download the Tanzu Observability by Wavefront nozzle file from the Tanzu Network to your local filesystem. You must have a Tanzu Network account to perform this task.
Step 2: Ops Manager: Install, Configure, and Deploy the Nozzle
To install the nozzle:
- Download the VMware Tanzu Observability TAS tile version 4 from VMware Tanzu Network.
- Log in to Ops Manager, select Installation Dashboard, click Import a Product, and upload the file you just downloaded.
- Under Import a Product, click the plus sign (+) next to the version number of VMware Tanzu Observability by Wavefront nozzle. This adds the tile to your staging area.
The tile is now available, but the orange bar at the bottom indicates that the product is not yet configured.
To configure the nozzle:
In Ops Manager, click the Tanzu Observability by Wavefront tile. With Settings selected (the default), follow these steps:
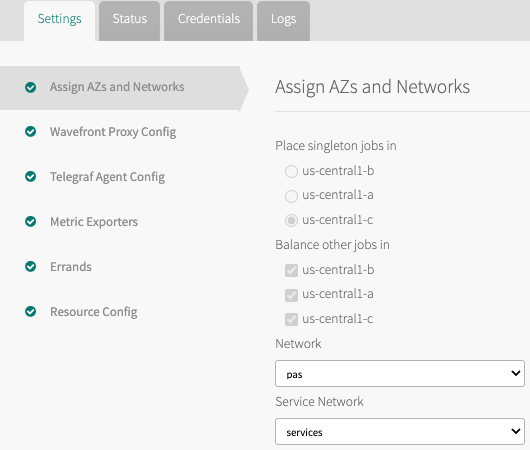
Step 1. Click Assign AZs and Networks, to configure the availability zone and network settings.
|
 |
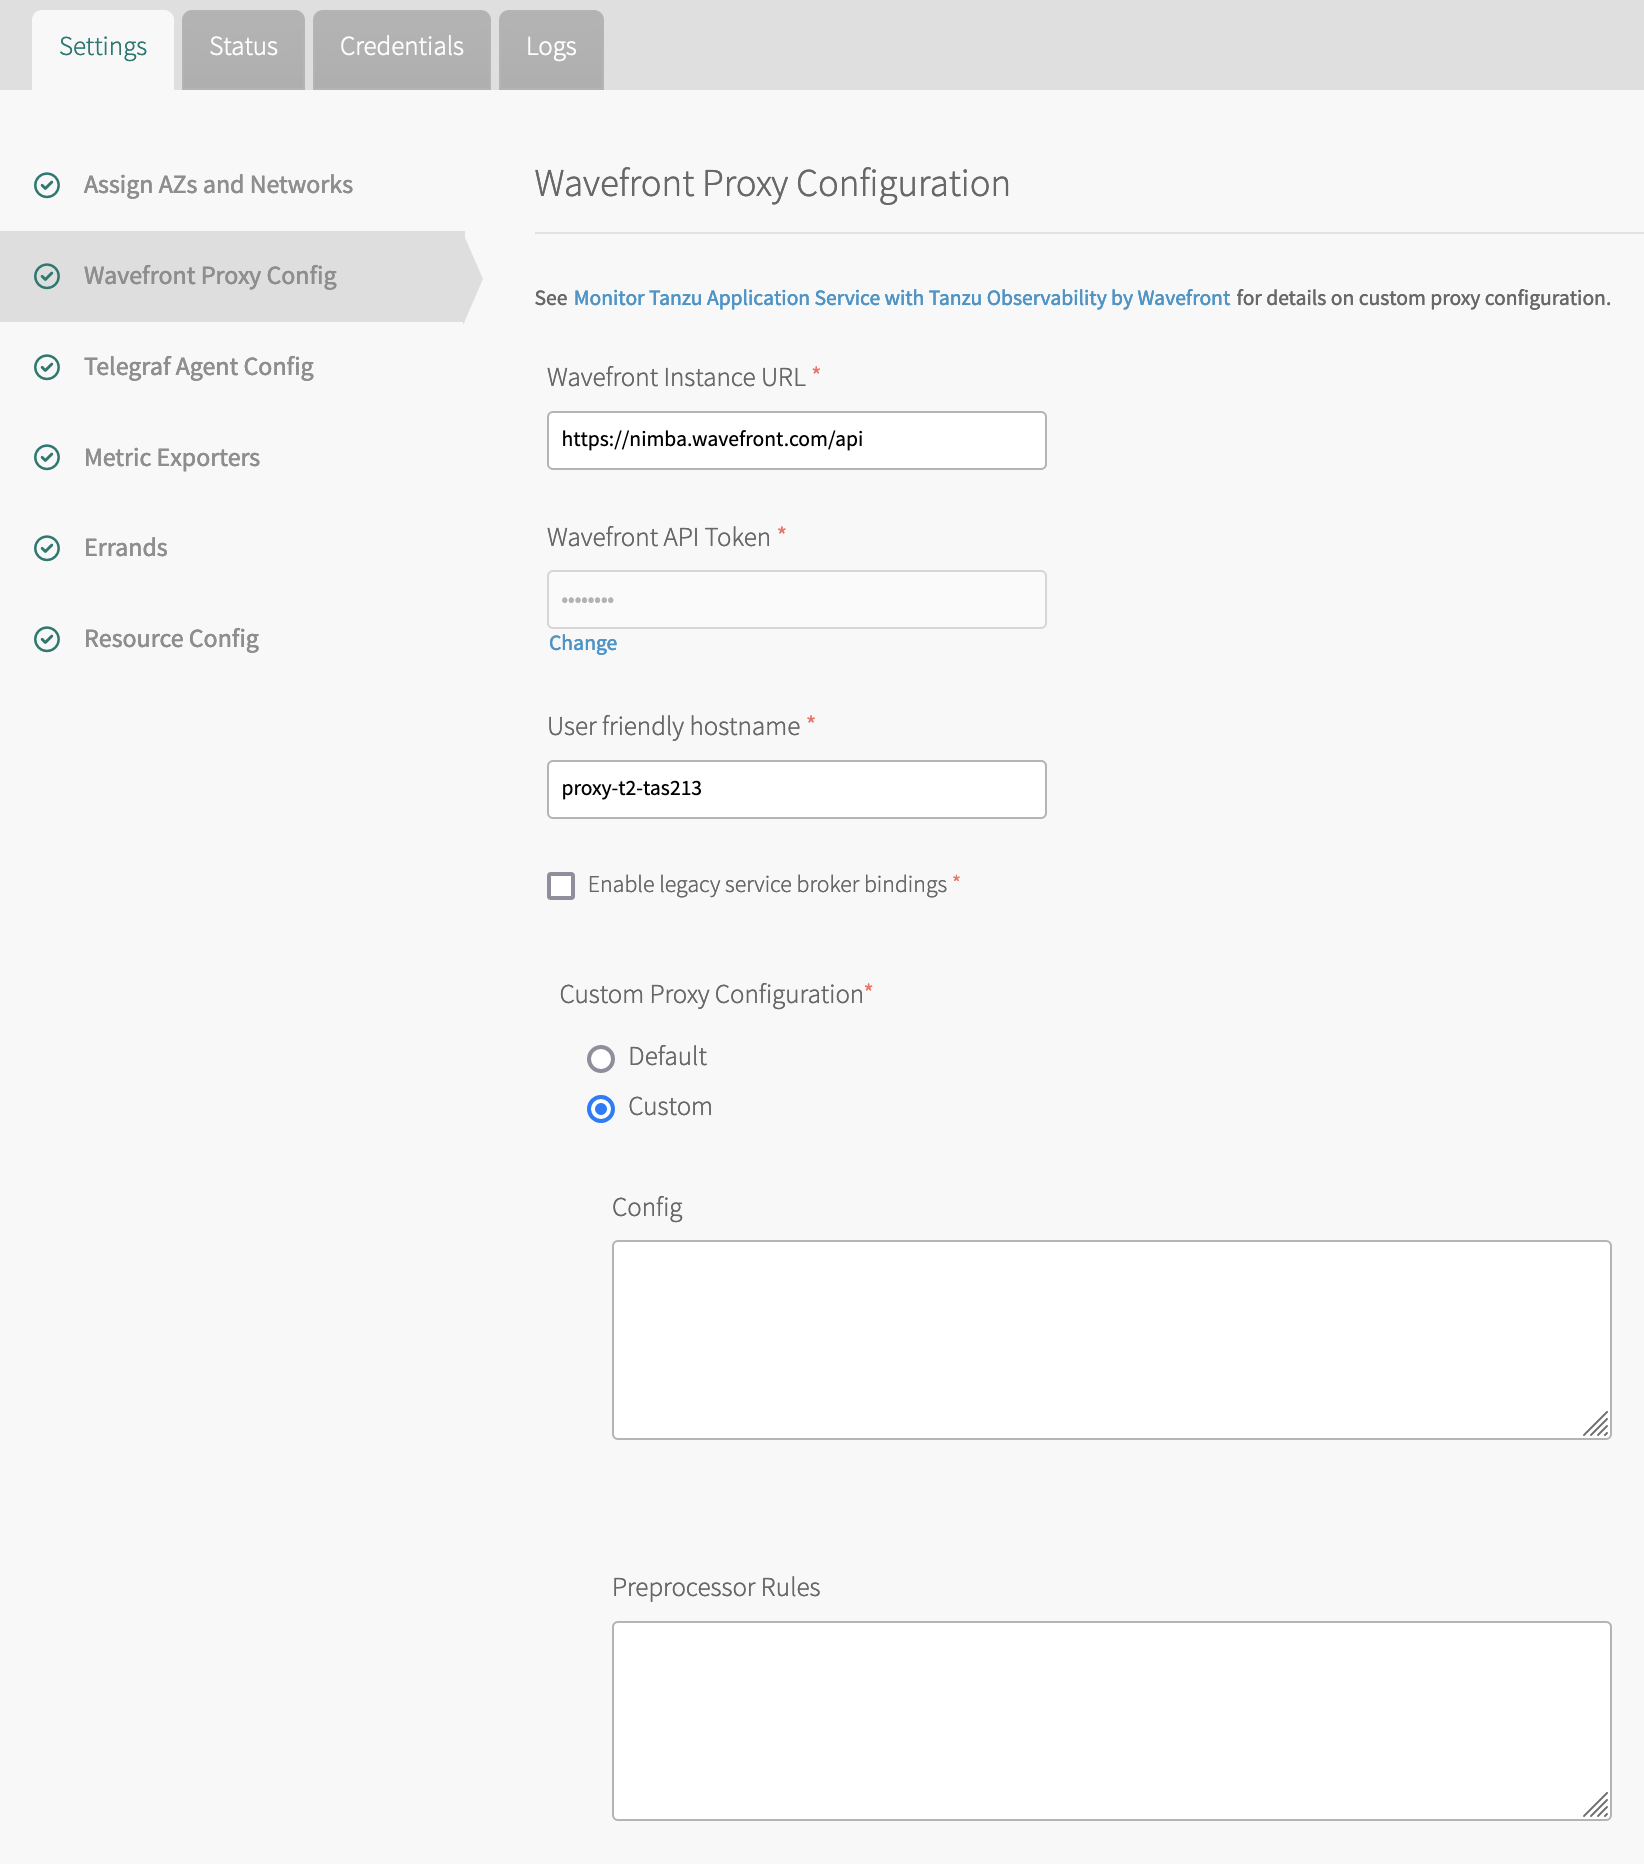
Step 2. Click Wavefront Proxy Config and specify:
|
 |
Step 3. Click Telegraf Agent Config and customize the Telegraf Agent config or accept the defaults.
|

|
Step 4. Click Metrics Exporters to customize metrics export from Tanzu Application Service.
|
 |
| (Optional) Step 5. Errands are scripts that can run at the beginning and at the end of an installed product’s availability time. Most users don't make changes to Errands for this nozzle. | 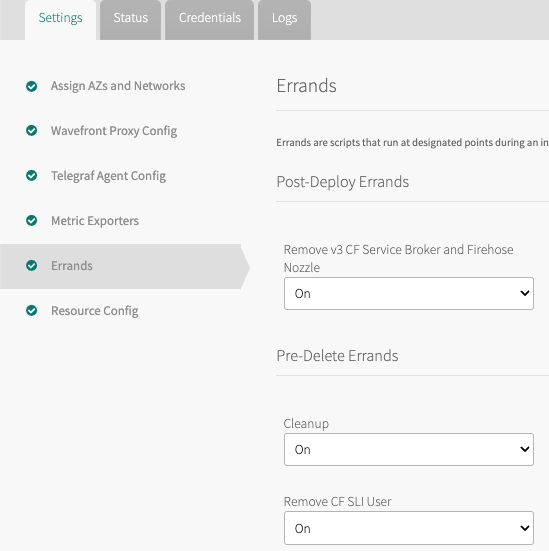 |
| (Optional) Step 6. Click Resource Config to review the VM sizing for the deployment.
You can choose smaller than default VMs to save money on small and noncritical foundations, and very large VMs with lots of CPU and MEM to scale for large foundations with high volumes of metrics. If, in Step 3, you have selected to use an additional Telegraf VM, set Additional Telegraf Agent option to Automatic:1. Note: SM Forwarder is set to Automatic:0. Do not change this setting. |
 |
Step 3: Check That Metrics are Flowing and Examine Your Data
Log in to your Wavefront instance and confirm that metrics are flowing:
- Click Integrations in the toolbar, search for Tanzu Application Service, and select the integration.
- Click the Metrics tab and confirm metrics are flowing.
Step 4: Use Dashboard to Examine Your Data
- With the integration selected, click the Dashboards tab.
- Select from the set of predefined dashboards, which are modeled on the corresponding Healthwatch dashboards but have additional options. For example, you can examine multiple foundations from one dashboard.
- Explore one or two dashboards. Examine Data with Dashboards and Charts has an overview and includes a video.
- As appropriate, clone any of the existing dashboards to add charts, modify queries, and more. See Create, Customize, and Optimize Dashboards and Create and Customize Charts.
Step 5 (Optional): Use the Service Broker to Send Custom Application Metrics to the Wavefront Proxy
- In Ops Manager, in the Wavefront Proxy Config panel, select the Enable Service Broker Bindings check box.
-
To provision a Wavefront proxy service instance, run the command:
cf create-service wavefront-proxy standard SERVICE_INSTANCE_NAME -
To bind apps to the service instance, run the command:
cf bind-service APP_NAME SERVICE_INSTANCE_NAME - If you already have an existing app and want to update its service instance reference from the v3 broker,
first unbind it with this command:
cf unbind-service APP_NAME SERVICE_INSTANCE_NAME
Note: For information about how apps can send metrics to the Wavefront proxy, see the cloud-foundry-sampleapp.
Step 6 (Optional): Connect Multiple Proxy Instances to an IAAS Load Balancer
Set Up the Load Balancer in Your IAAS
If you use multiple Wavefront VMs, you will want to use your IAAS of choice to set up a load balancer. BOSH DNS does not provide load balancing, so increasing the VM count will result in one VM taking all the requests.
In-depth instructions on configuring load balancers in different IAASes is beyond the scope of this documentation. You can see a detailed example across two sections of the TAS for VMs documentation:
- Initial setup of load balancers is required for AWS and GCP, but not for Azure.
- After the initial setup, you can use this document for finalizing the configuration of the load balancers in all IAAS.
Replace the example names for the load balancers from the documentation with names that suit a Wavefront proxy. You can ignore the portions of these docs that contain information about interactions with Ops Manager, because we will talk about that in the next section.
- For GCP, record the backend service name of your load balancer.
- For AWS, record the actual Elastic Load Balancer name.
- For Azure, record the Azure Load Balancer name.
Configure the Tile to Use the Load Balancer for the Wavefront Proxy
- Click the Resource Configuration tab for the tas2to tile in your Ops Manager configuration.
- In the left column, click Wavefront Proxy Configuration.
- Enter
http:${load_balancer_name}, whereload_balancer_nameis the load balancer or backend service name from the initial setup. - Apply the changes to the tile and wait until the process completes.
Configure the Tile’s Telegraf Instance to Send Traffic to the Load Balancer
By default, the Telegraf instance inside the tile will still use BOSH DNS. If you want the Telegraf requests to the Wavefront proxy to go through the load balancer, you must configure this.
- Click the Telegraf Agent Config tab for the tile.
- Under Advanced Options, click Yes.
- In the Custom Proxy URL and Custom Proxy Port fields, enter the URL and port number for your load balancer.
- Apply the changes to the tile.
Learn More!
- All users can learn about examining your data.
- Users with Dashboards permission can clone any dashboard and customize the dashboard and the charts.
- Go to the Tanzu Observability VMware TV channel for playlists of videos that include Getting Started, How to Use Dashboards and Charts, How to Use Alerts, and more!
