Sometimes you expect to see certain data in VMware Aria Operations for Applications (formerly known as Tanzu Observability by Wavefront) but, for some reason, it doesn’t show up! This can be a frustrating and confusing experience, especially when you urgently need the data. What could be the problem?
This doc page, based on the extensive experience of our customer success team, helps you investigate, understand, and remedy possible causes. In addition to manually investigating and troubleshooting your issues, you can use the Query Analyzer which helps you identify where exactly the problem is.
Techniques: Check, Quote, and Untangle
Before you look at possible reasons for your No Data result, follow these steps that our customer success team recommends.
Step 1: Check for Typos
It might sound surprising, but many No Data problems are the result of a typo in the metric name, source name, tag name, etc. Mistakes like that can be difficult to find, but it’s well worth the trouble to double-check for typos.
Step 2: Quote
Because of character limitations imposed by the Operations for Applications Data Format, it’s possible that your queries cannot recognize source names or tag names unless they are surrounded by double quotes. See Data Format Best Practices.
Step 3: Untangle
A query can return No Data if one of its elements returns No Data. An easy way to check which element of your query returns No Data is to create a set of separate queries and use variables to refer to the result of the query. You can use the Show/Hide button in the query line to look at individual results.
Here’s a simple example:
You run the following query:
sum(ts(~sample.requests.latency AND source="app-13")/ ts(~sample.requests.latency AND source="ap-12"))
The result is No Data, because there’s a typo.
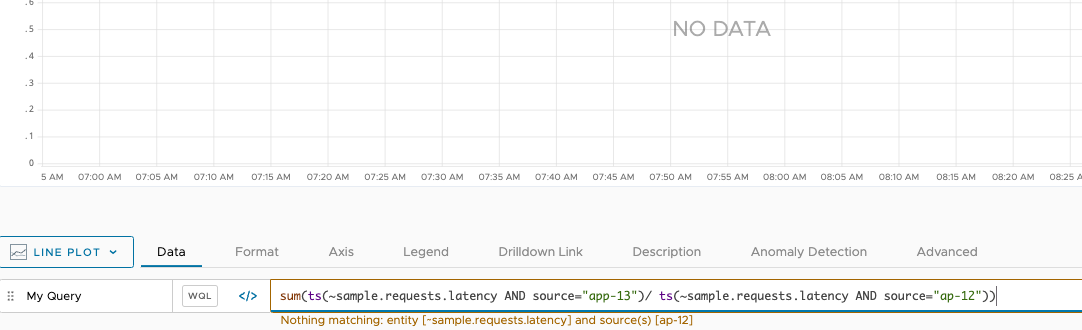
The message below the query line already indicates where the problem is, but you decide to be systematic and split up the query. You can use the name of each query as a variable in the query that performs the aggregation.
As part of the process, you can show/hide queries as needed to see which query is the culprit.
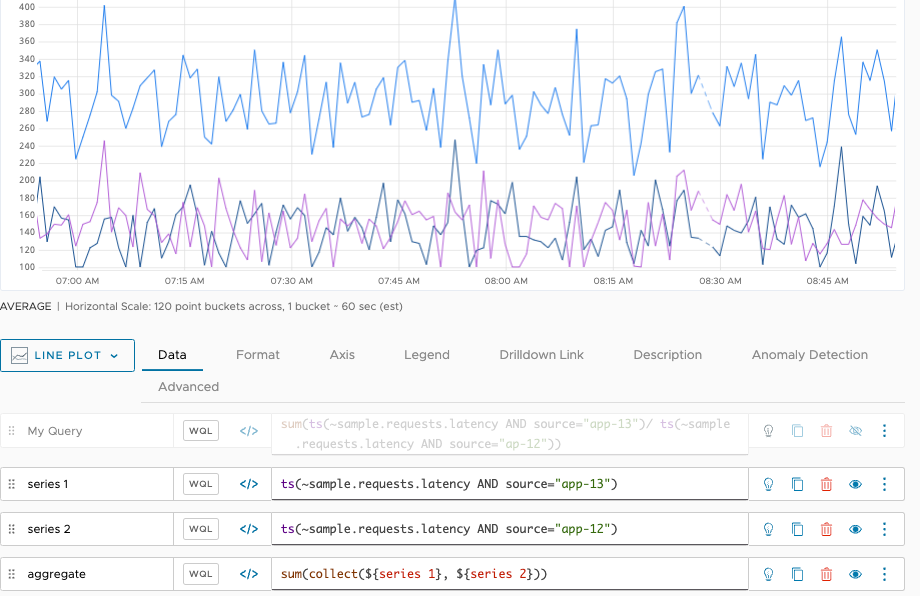
When you correct the problem, the data for both series becomes available and the sum() function returns the correct result.
In the example screenshot, we’ve hidden the two component queries so they don’t show up. The sum now returns results.

Problem: You Expect to See Data But It Isn’t There
It’s not uncommon that users expect to see data in a chart or an alert but the data isn’t there.
Symptoms
- You do not see the data in charts and dashboards.
- Below a query, you might get a message like the following:
Specified metric/histogram/span does not existPoint tag does not existNothing matching: <metric name> and source[]
- Below a query, you see a syntax error message.
In this section, you learn how to investigate. Here’s an overview of the steps:

Step 1: Check the Time Window
At times, you’re looking at a chart and the chart’s time window is not set to the time during which data was flowing. For example, suppose you discovered a week ago that there were problems with networking data for a certain host. You replaced the host, and want to show last week’s problem to a co-worker. You have to make sure that you look at a time window before the host was replaced.
As a first step, expand the chart’s time window and see if the data of interest shows up. You try looking back up 28 days. If you still don’t see your data, go to the next step and consider including obsolete metric.
Step 2: Consider Include Obsolete Metrics
If a time series hasn’t ingested any data points for a certain period of time, we consider the time series obsolete. The obsolescence period (by default 2 weeks) is configurable and might vary. You can see your current configuration by looking into the Advanced settings of any chart or dashboard. By default, obsolete data is not included in charts to improve chart loading. If you want to see the data:
- In the chart, click Advanced and select Include Obsolete Metrics.
- In the dashboard, you can turn on obsolete metrics for each chart, but performance can suffer.

Step 3: Check if Sampling or Filtering Excludes Data
Both the chart UI and the query language support data sampling and filtering. It’s possible that the data you are expecting to see is being sampled or filtered.
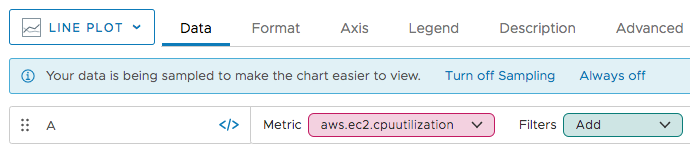
Step 4: Check if Chart-Level Sampling Hides Your Data
You can improve the display speed for all charts by turning on Sampling for your account. When you do, we limit the number of time series to 100 for each chart. If the time series you’re looking for wasn’t among the first 100, the chart doesn’t show it.
You can toggle sampling as a user preference for all charts. If sampling is on, you can explicitly turn it off for individual charts.
To toggle Sampling for your account:
|
 |
|
 |
Check if Query-Level Sampling Hides Your Data
Several WQL functions can be used to return only a sampling of data, and not all underlying data. If you don’t see your data, check if any of the queries for the chart includes the following functions:
- align
- limit
- random
- sample
A second set of functions, listed under Query-Level Filtering Hides Your Data, filters the data. The result is the same: you might not see the data that you expect to see.
Check if Dashboard-Level Filtering Hides Your Data
Users can apply global variables or filters to a dashboard to explicitly filter out data. If you don’t see the data you expect to see in a dashboard, check if a filter is set for the dashboard. For example, if the filter is set to env = production, as in the following screenshot, then you won’t see data for env = dev or env = qa.

Check if Query-Level Filtering Hides Your Data
Several WQL functions can be used to filter the data that a query returns before the data appears on the chart. If you don’t see your data, check if any of the queries for the chart includes one of the following functions:
- align
- bottom
- bottomk
- filter
- globalFilter
- lowpass
- highpass
- retainSeries
- removeSeries
- top
- topk
Problem: Ingestion Delays
One of the most common reasons data that you don’t see data that you expect to see is ingestion delays. If ingestion delays are the problem, the data eventually shows up. However, you’ll see a discrepancy between the timestamp of the data point and when the data point is actually visible on a chart.
For example:
- A data point is timestamped for 12:00:01 UTC
- Because of data delays, that point does not show up on charts until 12:04:35 UTC.
Ingestion delays often happen at the data source or in the data pipeline, for example, certain cloud platforms only send data with a delay. Limiting the Impact of Data Delays explores how delayed data can affect alerting behavior.
Step 1: Find Data Delays at the Proxy
Cloud integrations do not use a Wavefront proxy, but for many integrations, data are sent from a source to the Wavefront proxy. The proxy sends the data to the product service.
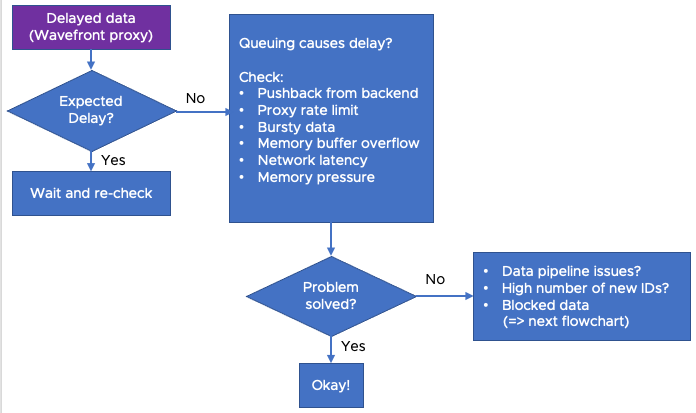
There are several possible reasons for queues at the proxy. The Monitoring Wavefront Proxies and the Queuing Reasons chart in the Operations for Applications Service and Proxy Data dashboard are especially helpful for identifying the cause for queuing, discussed next:
- Pushback from Backend
- Proxy Rate Limit
- Bursty Data
- Memory Buffer
- Network Issues
- Memory Low on Proxy Host
Proxy Queue Reasons: Pushback from Backend
If the rate of data ingestion is higher than backend limit, the proxy queues data. The backend limit typically depends on the commit rate specified in your company’s contract with VMware. When you attempt to ingest data at a higher rate than the backend limit, data is queued up at the proxy.
Troubleshooting & Further Investigation
- Look for pushback in the Queuing Reasons chart of the Operations for Applications Service and Proxy Data dashboard.
- Use the query in the Data Ingestion Rate (Points) chart of the Operations for Applications Service and Proxy Data dashboard to keep track of your ingestion rate. Ensure the ingestion rate is within contractual limits to avoid overages. While it’s possible to ask Support to raise the backend limit such a change can result in overages.
Proxy Queue Reasons: Proxy Rate Limit
If the proxy is configured with a rate limit, and the rate of data sent to the proxy is above the limit, the proxy starts queuing data. The Proxy Rate Limiter Active chart in the Operations for Applications Service and Proxy Data dashboard provides insight into whether data is coming in faster than the proxy rate limit supports.
Troubleshooting & Further Investigation
- Confirm whether data is coming in faster than the proxy’s rate limit configuration (
pushRateLimit). If so, look into ways to reduce your data rate. - On the Operations for Applications Service and Proxy Data dashboard find the Proxy Troubleshooting section and examine the Proxy Rate Limiter Active chart to see whether the rate limiter is active on the different proxies in your environment.
- Confirm the
pushRateLimitof each proxy by looking at the proxy configuration file or by querying--proxyconfig.pushRateLimit. - Go to the Received Points/Distributions/Spans Per Second charts in the Operations for Applications Service and Proxy Data dashboard
- Examine the ingest rate for the proxy that seems to have rate limit problems.
- Use the Filter feature at the top of each dashboard or chart or specifying a specific source name in the underlying queries to filter for the proxy you are interested in.
Proxy Queue Reasons: Bursty Data
This can be related to either of the two points above. If your rate of data is very bursty, you may also experience queueing. “Burstiness” means that data is sent in bursts rather than being sent evenly over time. For instance, the average PPS (points per second) over a minute may be 1000.
- That could be the result of 1000 data points sent for each of the 60 seconds within that minute.
- That could also be the result of 60,000 data points sent at one particular second within that minute and no data sent for the rest of the minute.
Because rate limits are set assuming a steady rate, that burst of 60,000 PPS for that one second could result in data being queued if the rate limit is less than 60,000 PPS.
Troubleshooting & Further Investigation
- Explore the Received Points/Distributions/Spans Max Burst Rate (top 20) charts in the Operations for Applications Service and Proxy Data dashboard provides to understand the burstiness of your data rate. The queuing ability of the proxy normally helps smooth out the data rate through momentary queuing.
- If you find that the proxy queues sustain and continue to grow, then the overall data ingest rate is too high.
- Either reduce the ingest rate or request that the backend limit be raised (this could result in overages).
Proxy Queue Reasons: Memory Buffer
If the data ingestion rate is so high that the memory buffer fills too quickly, the proxy queues data. The proxy:
- Holds a certain number of data points in memory (set through the
pushMemoryBufferLimitconfiguration property) - Stores data points on disk if the rate gets too high.
As the proxy processes data in the memory buffers, space is freed up for new incoming points. However, when the rate of ingest is so high that the buffer fills up more quickly than it is drained, more and more data points are queued up.
Troubleshooting & Further Investigation
- Find the Queuing Reasons chart in the Operations for Applications Service and Proxy Data dashboard and look for
bufferSize. - If you see problems, consider lowering the ingestion rate or distributing the load among several proxies.
- In some situations, it might make sense to adjust the
pushMemoryBufferLimitproxy property.- Raising this value results in higher memory usage.
- Lowering this value results in more frequent spooling to disk.
Proxy Queue Reasons: Network Issues
If network issues prevent or slow down requests from the proxy to the Operations for Applications service, then the proxy queue fills up because data arrives at the proxy faster than data can be sent to the service.
Troubleshooting & Further Investigation:
- Go to the Network Latency chart in the Proxy Troubleshooting section of the Operations for Applications Service and Proxy Data dashboard. This chart tracks the amount of time from when the proxy sends out a data point to when it receives an acknowledgment from the backend.
- Ensure that this amount of time is in the range of hundreds of milliseconds. If the time reaches the range of seconds, check for network latency issues.
Proxy Queue Reasons: Memory Low on Proxy Host
The proxy configuration property memGuardFlushThreshold is meant to protect against out of memory situations. If heap usage on the proxy exceeds this threshold, data in memory will be flushed to disk and queued.
Troubleshooting & Further Investigation:
- Find the Queueing Reasons chart in the Operations for Applications Service and Proxy Data dashboard and examine the
memoryPressuremetric. - If there’s a problem, consider increasing memory limits for the host server.
Step 2: Understand Data Delays Inherent to Your Data Pipeline
If your data travels through a pipeline before reaching the Wavefront proxy or before being direct ingested to the Operations for Applications service, the pipeline itself can introduce delays to the ingestion process.
Troubleshooting & Further Investigation
Examine the Data Received Lag charts in the Proxy Troubleshooting section of the Operations for Applications Service and Proxy Data dashboard.
These charts can help if the data points are timestamped at or near the source of the data. The underlying metric used in these charts tracks the difference between the system time of the proxy host and the timestamp of data points. This difference can provide insight into how long it takes for a data point to traverse the data pipeline and reach the proxy.
Every pipeline inherently has its own latencies. Understanding the latencies helps you understand when data is expected to show up in charts. It can also help with crafting queries that this latency into account.
Step 3: Find Data Delays Caused by High Rate of New IDs
Components of each data point are converted into IDs at the backend (Operations for Applications service) before the points are stored. These components include metric name, source name, and the point tag key and value combination.
Each time the service detects a new name, it generates a new ID. ID generation adds to the ingestion time. When the rate of new IDs is low, this is negligible. However, when you send a large amount of new data at the same time and the ID generation rate is high, a backlog of items that need an ID can result. This backlog results in delays in ingestion.
Troubleshooting & Further Investigation
The Operations for Applications Usage integration includes several alerts that you can customize to be alerted when there is a high rate of new IDs.
- A high rate of new IDs can happen when you start sending new data to Operations for Applications.
- A high rate of new IDs could also indicate a cardinality issue with the data shape of the data you’re sending to Operations for Applications. For instance, if a timestamp was included as a point tag, a high number of unique point tags results. This can be a problem when you send the data to Operations for Applications, but also causes problems later when you query the data. See Data Naming Best Practices for best practices.
Problem: Blocked Data
The Wavefront proxy or the product service block data for a variety of reasons. When this happens, the data is dropped and is not ingested. If data is blocked at the proxy, the proxy log includes a message indicating the reason.
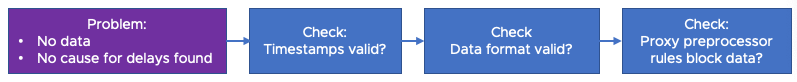
Step 1: Do Invalid Timestamps Block Data?
By default, the proxy and the service allow data points that are timestamped between:
- 8760 hours (1 year) ago
- 24 hours (1 day) ahead of the current time
This functionality supports back-fill of old data or pre-fill future data. Make sure that the timestamp of your data points is in this range. Data with a timestamp outside this range will be rejected at the proxy or not ingested by the Operations for Applications service. If you have a use case for ingesting data outside this time range, update the proxy configuration and contact Support to have the backend configuration for your environment updated.
Step 2: Do Invalid Data Format Block Data?
The proxy supports a variety of data formats. Most environments are set up to use different ports for different formats. Ensure that data is being sent to the proper port.
For data that is in the Operations for Applications data format, see this page for information on what is and is not valid and on the limits that are in place.
- Each component of the data point has a set of allowed characters and length limits.
- There is also, for example, a default limit of 20 points tags per data point.
Step 3: Do Proxy Preprocessor Rules Block Data?
The proxy supports setting up custom preprocessor rules to allow or block certain data. Ensure that your data meets all the rules set-up at the proxy. You may need to reach out to the team that manages the proxy and/or those rules.
Learn More
- Optimizing the Data Shape to Improve Performance might have hints on why you don’t see the results you expect.