VMware Aria Operations for Applications (formerly known as Tanzu Observability by Wavefront) supports monitoring of your Wavefront proxies.
- With the Proxies Browser, you can explore a detailed list of all your proxies.
- With the out-of-the-box dashboards that are based on proxy internal metrics, you can examine the health and the usage of your proxies.
Examine Your Proxies with the Proxies Browser
Get Started with the Proxies Browser
With the Proxies Browser you can examine the status and the details of each proxy.
A proxy status can be:
| Status | Description |
|---|---|
| Active | The proxy is running and sending data. |
| Orphaned | The proxy stopped sending data. The reason can be:
|
| Stopped by Server | The Operations for Applications subscription has ended for the customer. |
| Token Expired | The API token has expired. You must install a new proxy. |
Select Browser > Proxies to display the Proxies Browser.
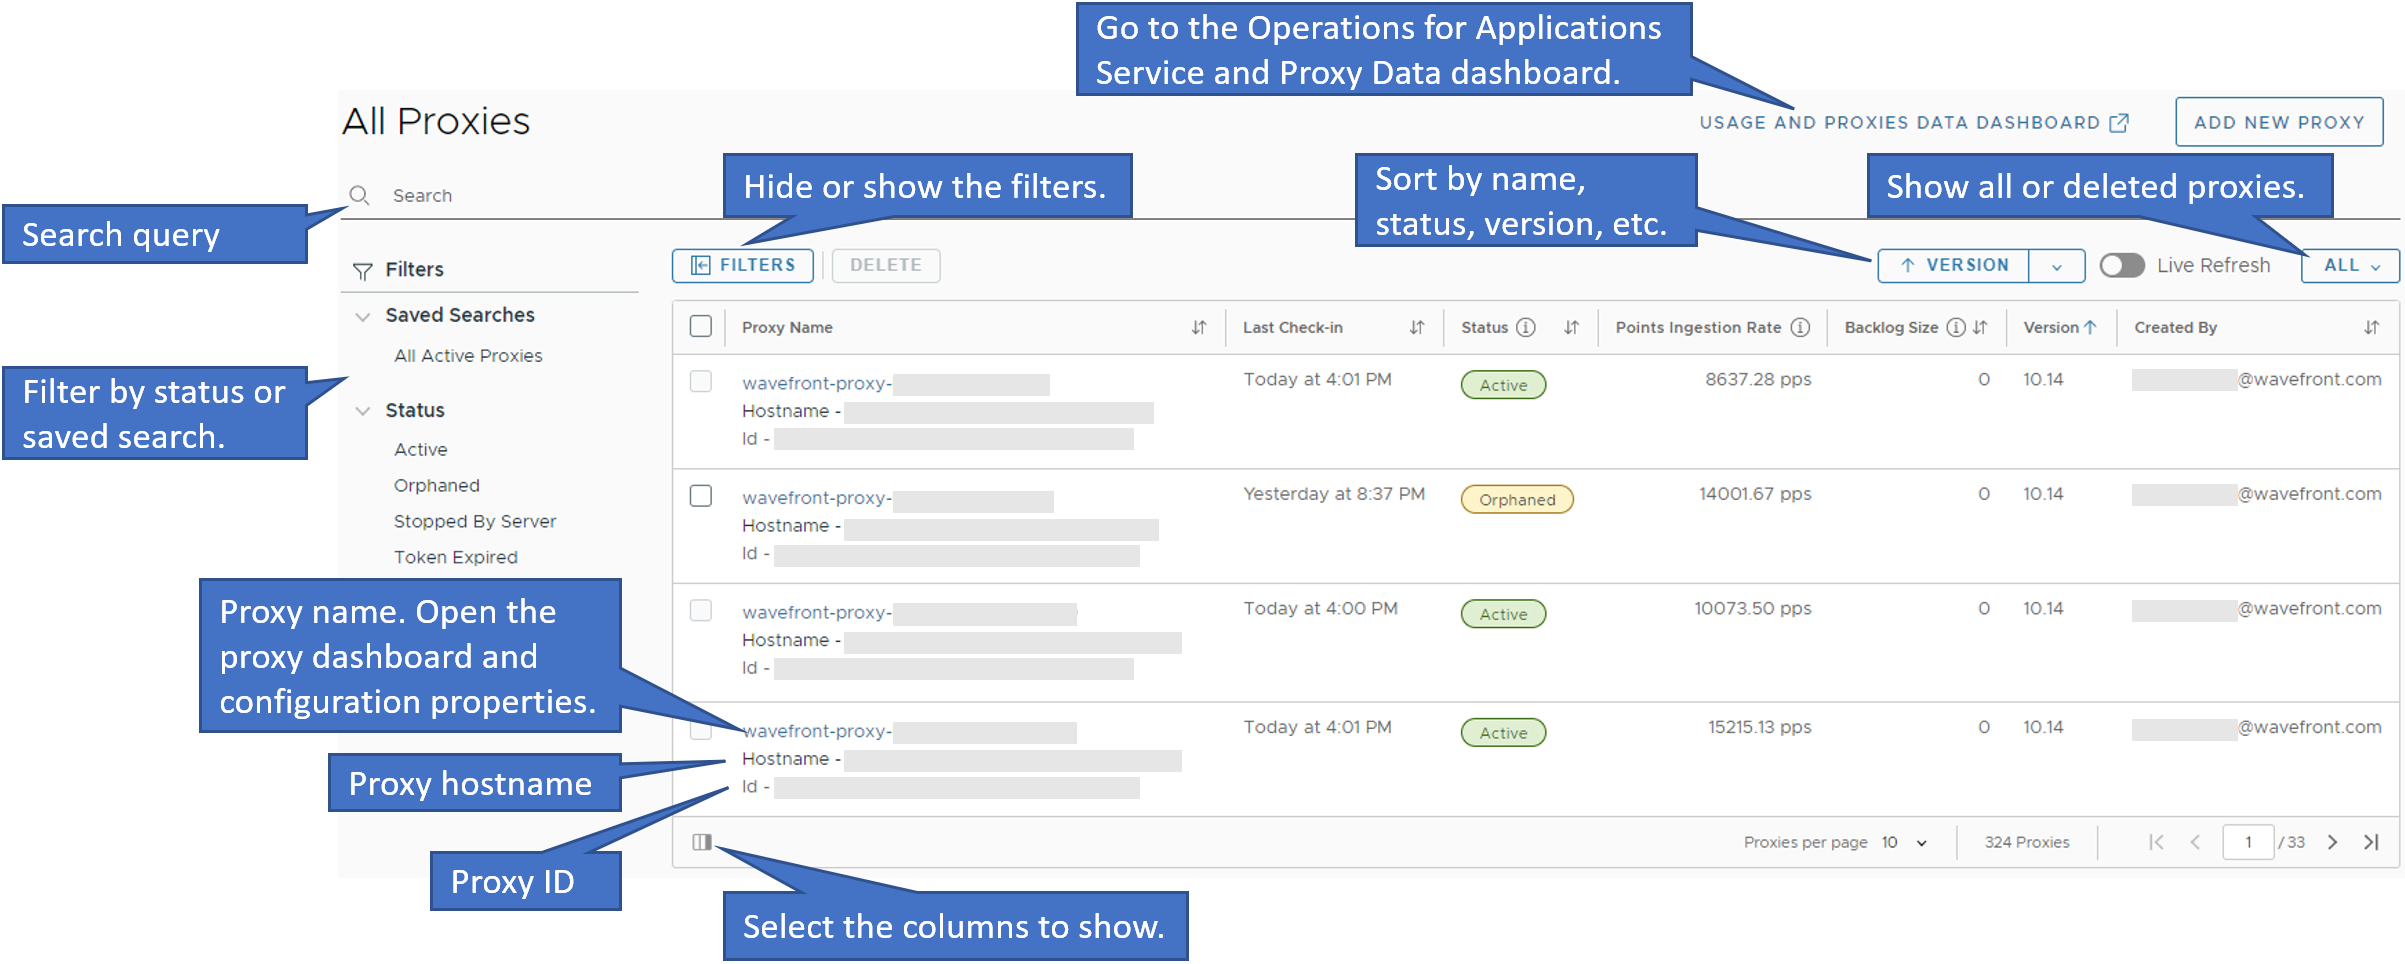
On the Proxies Browser page, you can see the details about each proxy - name, hostname, ID, last check-in date and time, status, ingestion rate by data type, version, and the user who created it.
In addition, you can:
- Sort the proxies by name, last check-in time, status, version, or the user who created the proxy.
- Search and, optionally, save and share your search.
- Filter the proxies by status.
- Hide or show the filters.
- Show All existing or Deleted proxies list. The Deleted proxies list shows the ephemeral proxies that were deleted during the last 24 hours and the non-ephemeral proxies that were deleted during the last 1 month.
- Configure the proxies table columns.
- Open the dashboard and see the current configuration properties of a proxy by clicking the proxy name.
- Go to the Operations for Applications Service and Proxy Data dashboard of the Operations for Applications Usage integration by clicking Usage and Proxies Data Dashboard.
Examine the Health and Usage of a Proxy with the Proxy Dashboard
- On the Proxies Browser page, click the name of the proxy you are interested in.
-
On the Overview tab, examine the proxy dashboard, which contains charts based on proxy internal metrics, organized in the following sections:
Section Description Overview Shows the details of the proxy and charts about: - Proxy queue size per data type
- Available space
- Network latency
- Latency by queueing and reasons for queueing
Metrics Shows charts about the metric data points that are received, queued, and blocked by the proxy. Distributions (Histograms) Shows charts about the metric distributions that are received, queued, and blocked by the proxy. Traces (Spans) Shows charts about the traces that are received, queued, and blocked by the proxy. Logs Shows charts about the logs received, queued, blocked, and dropped by the proxy. Advanced Shows charts for troubleshooting the proxy, such as, the proxy memory heap, file descriptor usage, GC events, incoming HTTP requests, data lag, connections, network latency, time spent for the preprocessing rules, queue time, and rate limiter.
Examine the Proxy Configuration Properties
For Wavefront proxies 12.2 and later, you can examine the proxy configuration properties with their current values in the wavefront.conf file. To do that:
- On the Proxies Browser page, click the name of the proxy you are interested in.
- Click the Proxy Configuration tab and examine the current configuration properties of the proxy.
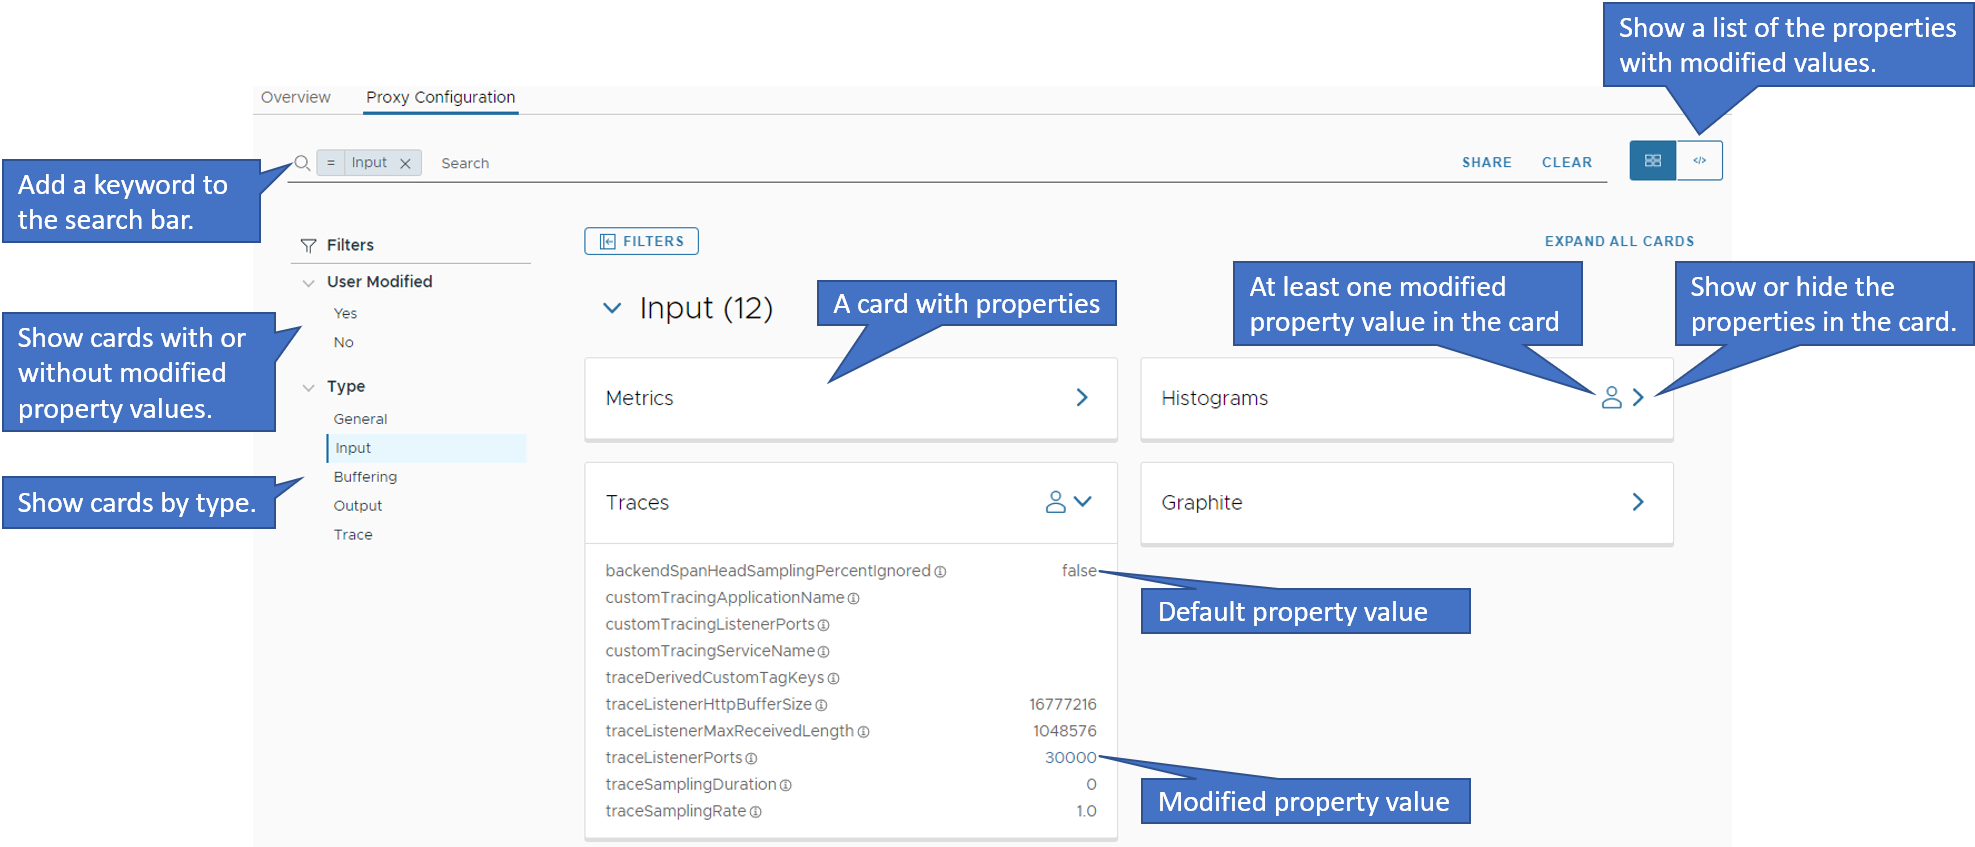
On the Proxies Configuration page:
- The configuration properties are organized in categories by type. The properties in each category are grouped in cards by subcategory.
- The cards with the user icon contain at least one configuration property with a modified value (different from the default value).
On this page, you can:
- Search for cards by a keyword in their property names.
- Filter the cards by user modified values, i.e. display the cards that contain or don’t contain a modified property value.
- Filter the cards by type (General, Input, Buffering, Output, and Trace).
- Expand a card and examine the configuration properties and their values. Modified property values are in blue color.
- Show the list of the configuration properties with modified values by clicking the code icon in the top-right corner.
Examine the Proxies Health and Usage with the Operations for Applications Usage Integration
The Operations for Applications Usage integration includes the predefined Operations for Applications Service and Proxy Data dashboard, which contains the Proxies: Overview and the Proxy Troubleshooting sections. These two sections comprise of charts based on the proxy internal metrics for examining the health of the proxies in your environment.
You can navigate to this dashboard in two ways:
- Select Dashboards > All Dashboards and search for the Operations for Applications Service and Proxy Data dashboard.
- On the Proxies Browser page, click Usage and Proxies Data Dashboard.
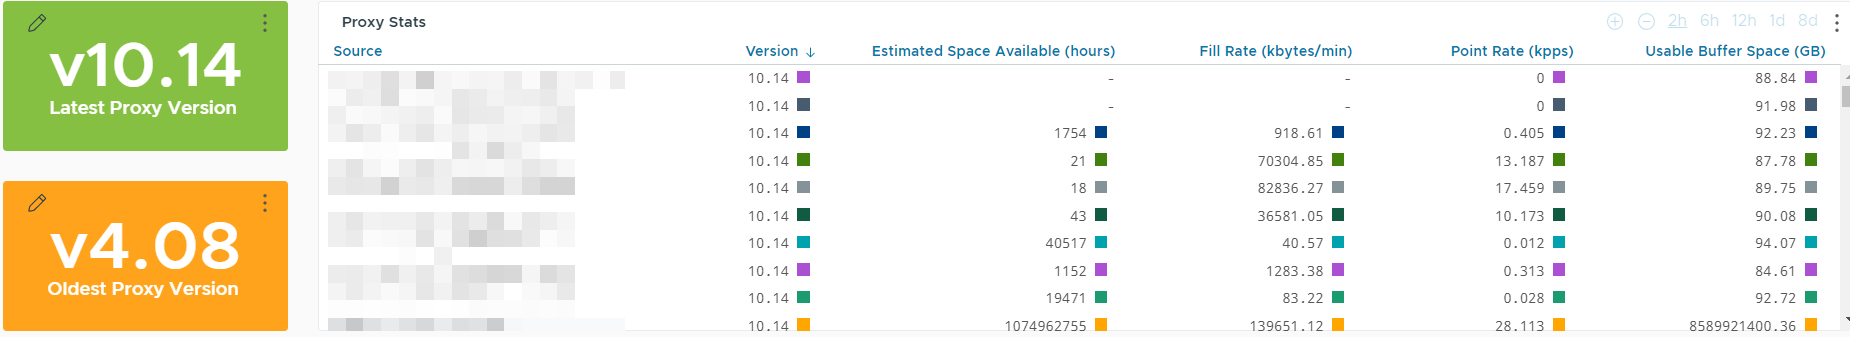
Proxies Overview
This section of the Operations for Applications Service and Proxy Data dashboard includes a number of charts that show general information about the proxies in your environment, such as the rate at which each proxy receives points, the rate at which each proxy sends points to Operations for Applications, any queued or blocked points, and more.

The proxy statistics are shown in a tabular chart at the end of the section:
Proxy Troubleshooting
In this section of the Operations for Applications Service and Proxy Data dashboard, you can investigate second-level metrics that give you insight into questions, such as:
- Why are some points blocked?
- What’s the file descriptor usage on the proxy JVM?
- How long does it take for points to be pushed from the proxy to Operations for Applications?
For example, this row from that section shows latency metrics using ~proxy.push.*.duration.duration.median:

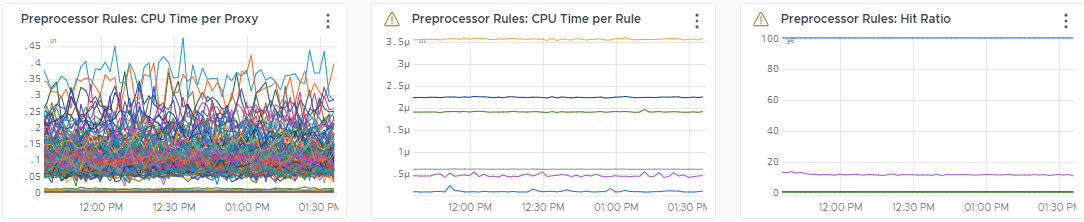
In this section of the dashboard, you can also monitor the time a proxy is spending with preprocessing rules. The charts show the time the JVM spends on the rules and determine the overall effectiveness of the rules. Rules that are not optimized can contribute to data lag. As a result, Operations for Applications will not receive the data in a timely manner.
For best performance, make sure that the expression leverages the regex best practices for the proxy rules and that your proxy runs the latest version.
The following charts help you understand the time a proxy spends on preprocessing rules:
-
Preprocessor Rules: CPU Time per Proxy
This chart shows an aggregate view of how long each proxy spends executing all the preprocessing rules.
-
Preprocessor Rules: CPU Time per Rule
This chart shows an aggregate view across all proxies showing how much time it takes to execute each rule for each message. This chart helps you display outliers and identify preprocessing rules which should be optimized.
-
Preprocessor Rules: Hit Ratio
This chart helps you identify preprocessing rules that are no longer in use or impact a high number of metrics being ingested. Use this chart to identify if there are some rules which should be deprecated or possibly fine-tuned.
Proxy Internal Metrics
The Wavefront proxies emit the ~proxy. set of internal metrics, which you can use to check if your Wavefront proxy is behaving as expected.
| Metric | Description |
|---|---|
~proxy.points.*.received |
Counter showing the total points the proxy receives, as a per-second rate. To look at the overall rate of points received across all the ports, you can sum up these series and look at the aggregate rate for a proxy. You can also look at the overall rate across all proxies by summing this up further. |
~proxy.points.*.delivered |
Counter showing the number of points successfully delivered to Operations for Applications, broken down by listening port. |
~proxy.points.*.queued |
Counter showing the number of points being queued to be sent to Operations for Applications from the proxy, as a per-second rate. Queueing usually happens for one of the following reasons:
|
~proxy.buffer.task-count |
Gauge of the amount of data that the proxy currently has queued. |
~proxy.buffer.points-count |
Gauge of the number of points currently in the queue. |
~proxy.points.*.blocked |
Counter of the points being blocked at the proxy, as a per-second rate. If this rate is above 0, you can look at the charts in the Proxy Troubleshooting section of the Operations for Applications Service and Proxy Data dashboard to determine if the metrics contain invalid characters or bad timestamps, or if they are failing configurable regular expressions. A small sample of blocked points – up to pushBlockedSamples – and a complete list of blocked points is written to the proxy log file. See the /var/log/wavefront/wavefront-blocked-points.log file for a complete list. See /etc/wavefront/wavefront-proxy/log4j2.xml for configuring for details on enabling and configuring the proxy log file. |
~proxy.buffer.fill-rate |
Rate at which the proxy buffer is filling up in bytes/min. |
~proxy.points.*.received |
Rate at which points are being received at the proxy. |
~proxy.buffer.bytes-left |
Available space (in bytes) on the proxy. |
~proxy.build.version |
Current version number of the proxy. |
~proxy.limiter.permits-denied |
Counter that shows how many points have been queued due to local proxy settings in wavefront.conf, i.e. the proxy rate limiting itself, not the Operations for Applications service pushing back. |
~proxy.point.badchars |
Count of points blocked because of an illegal character. |
~proxy.point.badtime |
Count of points blocked because of the timestamp (e.g. older than 1 year). |
~proxy.validationRegex.*.points-rejected |
The points rejected based on the allow list/block list validation (using regex) at the Wavefront proxy. |
~proxy.jvm.fd_usage |
% of file descriptors in use per proxy. If this metric reaches close to 100% of the allowed usage for the proxy, increase the uLimit on your system. |
~proxy.jvm.garbage-collectors.*.time |
Garbage collection (GC) activity on the proxy JVM. Anything larger than 200ms is a GC issue, anything near 1s indicates continuous full GCs in the proxy. |
~proxy.jvm.memory.heapMax/heapUsed |
Memory usage by the proxy process. |
~proxy.push.*.duration.duration.median |
Duration taken by points pushed from the proxy to reach Operations for Applications. Can help identify network latency issues. You can graph other percentiles. |
~proxy.points.*.received.lag.p95 |
95th percentile of time differences (in milliseconds) between the timestamp on a point and the time that the proxy received it. Large numbers indicate backfilling old data, or clock drift in the sending systems. |
~proxy.points.*.received.lag.p99 |
99th percentile of time differences (in milliseconds) between the timestamp on a point and the time that the proxy received it. Large numbers indicate backfilling old data, or clock drift in the sending systems. |
~proxy.buffer.queue-time.* |
Latency introduced by queueing. |