How you get your data into VMware Aria Operations for Applications (formerly known as Tanzu Observability by Wavefront) depends on your use case, but you have many options. You can use one of the supported integrations, or you can instrument your application and send data directly.
Watch this video to listen to the Wavefront co-founder Clement Pang’s talk about data ingestion. Note that this video was created in 2018 and some of the information in it might have changed.
The Big Picture
We support full-stack observability for:
- Time series metrics – the focus of this page
- Histograms
- Traces and spans
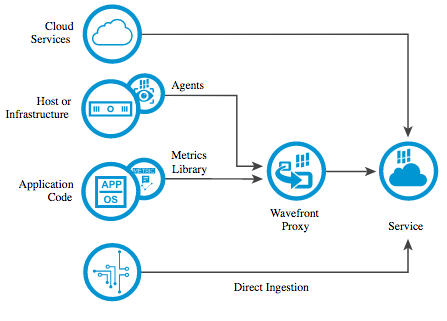
The data flow is like this:
- The metrics originate with your infrastructure or application. They could come from Telegraf, or a cloud service, or you might collect metrics with a custom metrics pipeline.
- You set up the data ingestion pipeline:
- For cloud services, you use one of the Cloud integrations – you don’t have to install or set up a Wavefront proxy.
- To monitor hosts, infrastructure, or applications, set up an integration. The integration Setup tab has instructions for getting the data flowing. For many integrations, you set up Telegraf to collect the metrics and create a Wavefront proxy (or select an existing proxy). The proxy forwards metrics from many sources to the Operations for Applications service.
- If no built-in integration for your data source exists, you can set up one of the collector integrations (such as a Telegraf integration) or you can stream your data to the Wavefront proxy. The proxy accepts metrics in OpenTSB, Grafana, and Operations for Applications data format.
- Another option is direct ingestion. In that case, you send data directly to the Operations for Applications service. Most customers and our SRE team prefer using a proxy – there are many benefits.
Step 1: Understand Your Use Case
Operations for Applications can help you get insight into the telemetry at all levels of your application stack. Here are the levels, and the associated use cases – for details on each use case see Step 2.
|
 |
We can help you retrieve, visualize, and alert on this information both for a more traditional environment and for Kubernetes environments.
Step 2: Get the Data In
The simplest path for any use case is to use a pre-built integration. If no integration exists, you can use one of the APIs.
Get Metrics from a Cloud Provider
Cloud integrations use a different setup process than other integrations. You log in to the cloud service, and give the Operations for Applications service read access to the metrics that you’re interested in. There’s no need to install or set up a Wavefront proxy.
We support integrations for the most popular cloud services. This doc set has customization information for example, for AWS Metrics Integration, AWS ECS Integration, AWS Lambda Functions, and Pivotal Container Service.
Set up an Infrastructure Integration
For use cases that center around infrastructure data like CPU, memory, or database metrics, you can set up your data ingestion pipeline by following these steps:
-
Find the integration for your use case. See the complete list of integrations.
-
Use the Setup steps in the integration to get data flowing from your application. As part of the setup, the integration lets you install a Wavefront proxy–or choose a Wavefront proxy if you already have one.
-
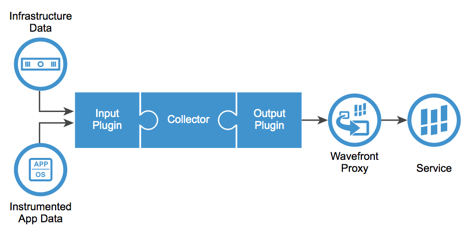
If no built-in integration exists, set up a collector agent such as Telegraf or collectd to collect your metrics. We support integrations for many custom collector agents. The collector agent can send your data to the Wavefront proxy.
Some collector agents, such as Telegraf, include an output plug-in for Operations for Applications. You add a configuration file to Telegraf that specifies which data you want to get from which host, and select the proxy to send the data to.
Many of the built-in integrations use Telegraf. We support different ways of using Telegraf, but also supports other agents. You can mix and match.
- The Active Directory integration is an example for a Windows Telegraf input plugin.
- The Mesos integration is an example for an environment where both primary and secondary server have to have Telegraf input plugins.
- The JBoss AS integration is an example for a Linux Telegraf plugin that uses Jolokia.
Instrument your Code
For use cases that involve metrics from proprietary applications, you can instrument your code. Use one of our instrumentation libraries for popular programming languages. For example, you can create a Java reporter object to use DropWizard metrics.
- Click Integrations and search for Application Integration to display the available application instrumentation integrations.
- Choose the integration that best suits your use case.
- Follow the Setup steps to register metrics and configure metric reporters. As part of the setup, the integration lets you install a Wavefront proxy or pick one if you have proxies in your environment.
Special Use Cases
If your company already has a custom metrics pipeline, follow these steps:
- Convert your data into one of the supported data formats. You can send data in Operations for Applications data format, Graphite data format, and OpenTSDB data format.
- Set up a Wavefront proxy. If you have a proxy installed in your environment, consider using that - or you can install a new proxy. See Installing and Managing Proxies
- Send the metrics you’re interested in to the Wavefront proxy at port 2878. In production environments, customers use 2 proxies behind a load balancer. Otherwise, 1 proxy is usually enough.
If you have metrics recorded in log files, follow these steps:
- Use the Filebeat Log Data built-in integration.
- Customize the process as discussed in Log Data Metrics Integration
Step 3: Examine and Alert
|
Once data is flowing, you can set up dashboards, charts, and alerts. With dashboards you can organize and customize the information about your environment. For example:
|
 |
Learn More!
- Watch the videos in the Get Started playlist on VMware TV.
- Learn more about histogram or distributed tracing capabilities.
- Have a look at some details about Wavefront proxies
Troubleshooting
- For an in-depth discussion, see Troubleshooting Missing Data.
- Telegraf Troubleshooting has details on troubleshooting and fine-tuning the Telegraf agent.
- Proxy Troubleshooting has tips and tricks from our SaaS Value Engineering team for common proxy problems.