When you get started with VMware Aria Operations for Applications (formerly known as Tanzu Observability by Wavefront), Chart Builder is the fasted way to customize which metrics you see and to display them in charts.
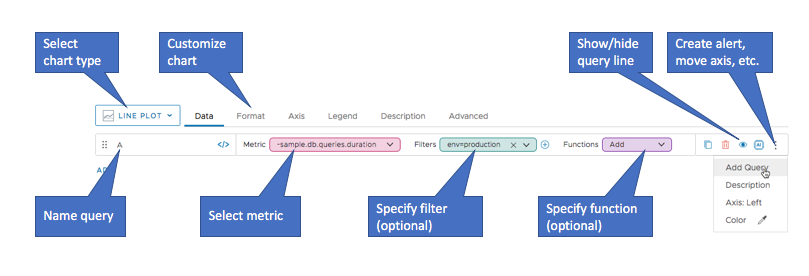
Chart Builder has the tools for creating charts and customizing which metrics you see.
- Construct queries from building blocks
- Show or hide individual queries
- Clone or delete a query line
- Create alerts directly from a query.
- Turn on Anomaly Detection.
Video
Here’s a 90 second overview of some of the main features. Note that this video was created in 2020 and some of the information in it might have changed. It also uses the 2020 version of the UI.
Get Started
When you create a new chart or edit an existing chart, we open the Chart Builder:
- Select Dashboards > Create Chart to create a new chart.
- Click the chart name of a chart you want to edit.
We open Chart Builder only if:
- Chart Builder is the default in your user preferences.
- The chart that you open for edit wasn’t open in Query Editor before.
Advanced functionality, such as chart variables, is available only in the Query Editor. Query Editor expects that you type the query using the elements of the query language.
- Switch from Chart Builder to Query Editor to use those advanced functions.
- You cannot switch from Query Editor to Chart Builder.
Select Metrics and Refine Your Chart
You always start by selecting a metric, and can then refine what’s visible in the chart with filters and functions.
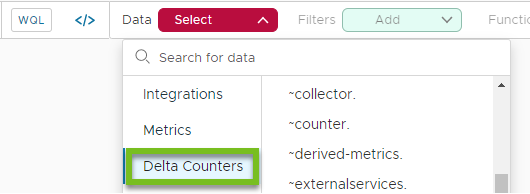
Select Data
You have these options:
|
 |
Specify Filters
Optionally, specify filters to narrow down what the chart displays.
|
This example filters a metric that supports specifying the value of two point tags (az and env), the source, and a source tag. See Organizing with Tags.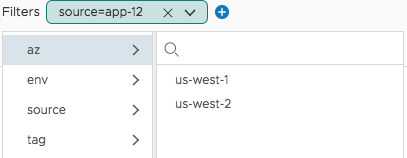 |
Add Functions
Functions allow you to perform aggregation, scaling, or rounding, use moving time windows, and more.
|
This example filters a metric that supports specifying the value of two point tags (az and env), the source, and a source tag. See Organizing with Tags.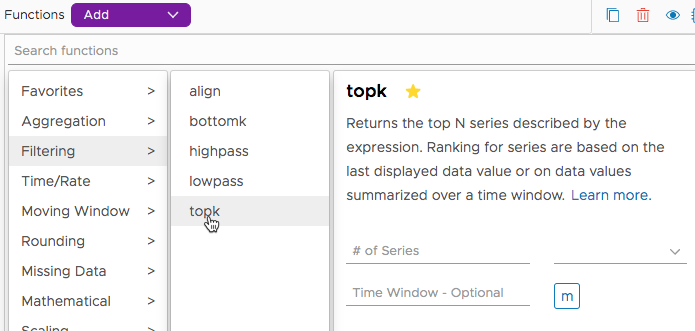 |
Group Results of a Function
For certain functions, the Group By field allows you to organize your chart. For example, you can show results for each of two env tags separately.In the example on the right, we're in the process of selecting the count function. |
 |
Example: Metric, Summed Metric, Grouped Sum
The following picture shows first the original metric, then the sum, and then the sum grouped by the env point tag.

Combine Chart Builder Elements
Chart Builder lets you:
- Replace metrics.
- Add query lines.
- Hide or show the results of selected queries in the chart.
- Add and remove filters.
- Add or remove functions, or change the order of the functions.
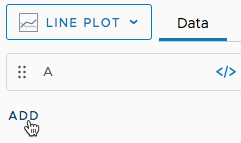
Add Query Lines
| To add a query line, click Add below the last line. |
 |
| To hide or show the results of a query, click the Hide/Show button. The chart no longer shows the result of that query though the query line is still visible in Chart Builder. |
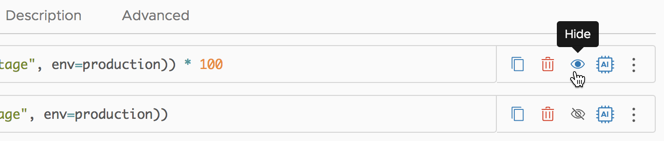 |
Add or Remove Filters
| To add a filter, click the + icon next to the filter. To remove a filter, click X in the filter bubble. |
|
Add, Remove, or Reorder Functions
You can add, remove, or reorder functions. Reordering might become necessary because, for example, first applying sum() and then deriv() yields a different result than first applying deriv() and then applying sum().
| To add a function, click the + next to the function. To remove a function, click the x on the function bubble. |
|
| To reorder functions, hover the cursor over the drag icon until the mouse changes shape, and then drag the function to the place you want it. |
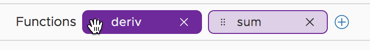 |
More Info
Advanced users can use Query Editor to take advantage of the complete set of query language functions.
See Wavefront Query Language Quick Reference for a complete reference. Each function links to a reference page.