VMware Aria Operations for Applications (formerly known as Tanzu Observability by Wavefront) supports monitoring time series, histograms, and traces.
-
Each time series consists of numeric data points for a metric, for example, CPU load or failed network connections. Time series can use one of the supported data formats. The type of data that you’re collecting determines the type of metric. Operations for Applications supports gauges, counters, delta counters, and more.
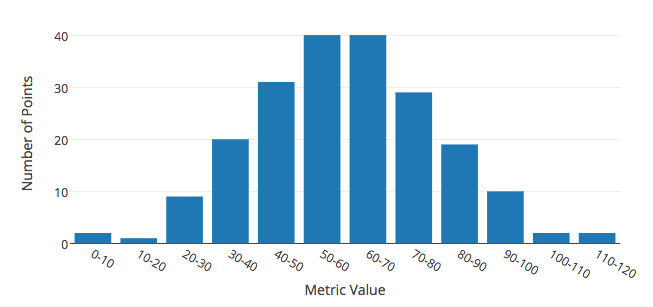
- Histograms let you compute, store, and use distributions of metrics rather than single metrics. Histograms are useful for high-velocity metrics about your applications and infrastructure–-particularly metrics that are gathered across many distributed sources.
- Distributed tracing enables you to track the flow of work that is performed by an application as it processes a user request. We support the OpenTracing standard. You can either visualize and examine traces coming from a 3rd-party system such as Jaeger or Zipkin, or instrument your application for tracing using one of our SDKs.
Metric Types per Data Type
The following table gives an overview of metric types. We introduce each type in more detail below.
| Metric Type | Description | Example |
|---|---|---|
| Gauge | Shows current value for each point in time. | CPU load, network connections. |
| Counter | Shows values as they increase. Counters only accumulate or reset to zero (do not decrease). | Number of failed connections, registered users. |
| Delta counter | Useful for monitoring bursty traffic in a Function-as-a-Service (serverless) environment. | Shows how many times a FaaS function executed (or failed). |
| Histogram | Supports computing, storing, and using distributions of metrics that use our histogram format. | Useful for very high frequency data. See the discussion of histograms. |
| Trace | A trace shows you how a request propagates from one microservice to the next in a distributed application. The basic building blocks of a trace are its spans. | You can think of a trace as a tree of related spans. The trace has a unique trace ID, which is shared by each member span in the tree. |
| Span | Spans are the fundamental units of trace data. Each span corresponds to a distinct invocation of an operation that executes as part of the request. | For example, in our BeachShirts sample application, we have the beachshirts.shopping operation, which includes many invocations of the Printing.getAvailableColors span. |
Gauges
A gauge shows the current value for each point in time. Think of a thermometer that shows the current temperature or a gauge that shows how much electricity your Tesla has left.
Many metrics are gauges. For example, our internal metrics include ~alert.checking_frequency.{id} and ~alert.query_time.{alert_id}.
Cumulative Counters
Cumulative counters (counters) show information over time. Think of a person with a counter at the entrance to a concert. The counter shows the total number of people that have entered so far.
Counter metrics usually increase over time but might reset back to zero, for example, when a service or system restarts. Users can wrap rate() around a counter if they want to ignore temporary 0 values and see only the positive rate of change. Using Cumulative Counters gives several examples.
For example, ~metric.new_host_ids and ~query.requests are internal metrics that are counters.
Delta Counters
Delta counters bin to a minute timestamp and treat write operations to the same bin as deltas. They are well suited for the kind of bursty traffic you typically get in a Function-as-a-Service environment. Many functions execute simultaneously and it’s not possible to monitor bursty traffic like that without losing metric points to collision.
For example, instead of one person with a counter standing at a single concert entrance, several people count, each at one entrance gate. Eventually the results from the counters can be added for total attendance. In the same way, Operations for Applications can aggregate delta counter information.
To have the Operations for Applications service treat a metric as a delta counter, you have several choices:
- Use the
cs()instead of thets()function. - Add a delta character prefix to the metric.
Using Delta Counters gives details and best practices.
Histograms
Operations for Applications can receive and store metrics at 1 point per second per unique source. However, some scenarios generate metrics even more frequently. Suppose you are measuring the latency of web requests. If you have a lot of traffic at multiple servers, you may have multiple distinct measurements for a given metric, timestamp, and source. Using “normal” metrics, we can’t measure this.
To address high frequency data, we supports histograms – a mechanism to compute, store, and use distributions of metrics. A histogram is a distribution of metrics collected and computed by the Wavefront proxy. Sending Histogram Distributions describes the histogram format, histogram ports, and some examples.
Traces and Spans
We follow the OpenTracing standard for representing and manipulating trace data.
-
A trace represents an individual workflow in an application. A trace shows you how a particular request propagates through your application or among a set of services.
-
Spans are the individual segments of work in the trace. A trace consists of one or more spans. Each span represents time spent by an operation in a service (often a microservice).
Because requests normally consist of other requests, a trace actually consists of a tree of spans.
Learn More!
Search this doc set for details on any of the metric types, or read this:
- Metrics and the Metrics Browser examines the structure of a metric and explains how to use the Metrics Browser.
- Cumulative Counters and Delta Counters discusses the 2 kinds of counters that we support and includes examples for each type.
- Histograms are useful for distribution of metrics in high-velocity environment. We support a set of query language functions just for histograms.
- Our Tracing UI lets you drill down from the service level to the individual spans and examine outliers to find bottlenecks.