As part of troubleshooting an application, you need an overview of the services and applications that send data to Operations for Applications. Use our application map to understand the health of each service, and troubleshoot when your applications or services run into issues. You can see the overall health of each application using the application map, table view, and grid view.
Application Map Features
The application map gives you an overview of how the applications and services are linked, lets you focus on a specific service, view Request, Error, and Duration (RED) metrics for each service, and the tracing traffic in the application. You can also drill down to the Service Dashboard and Tracing Browser.
This video highlights the application map features and settings. Note that this video was created in 2020 and some of the information in it might have changed. It also uses the 2020 version of the UI.
See the application map:
- Log in to your service instance.
- From the toolbar, select Applications > Application Status and click the Application Map icon (
 )
) - Optionally, click the link icon (
 ) to copy the URL and share what you’re seeing right now (NON-LIVE display) with other users.
Let’s walk through the following scenario to get a quick overview of the application map.
| Action | Result |
|---|---|
|
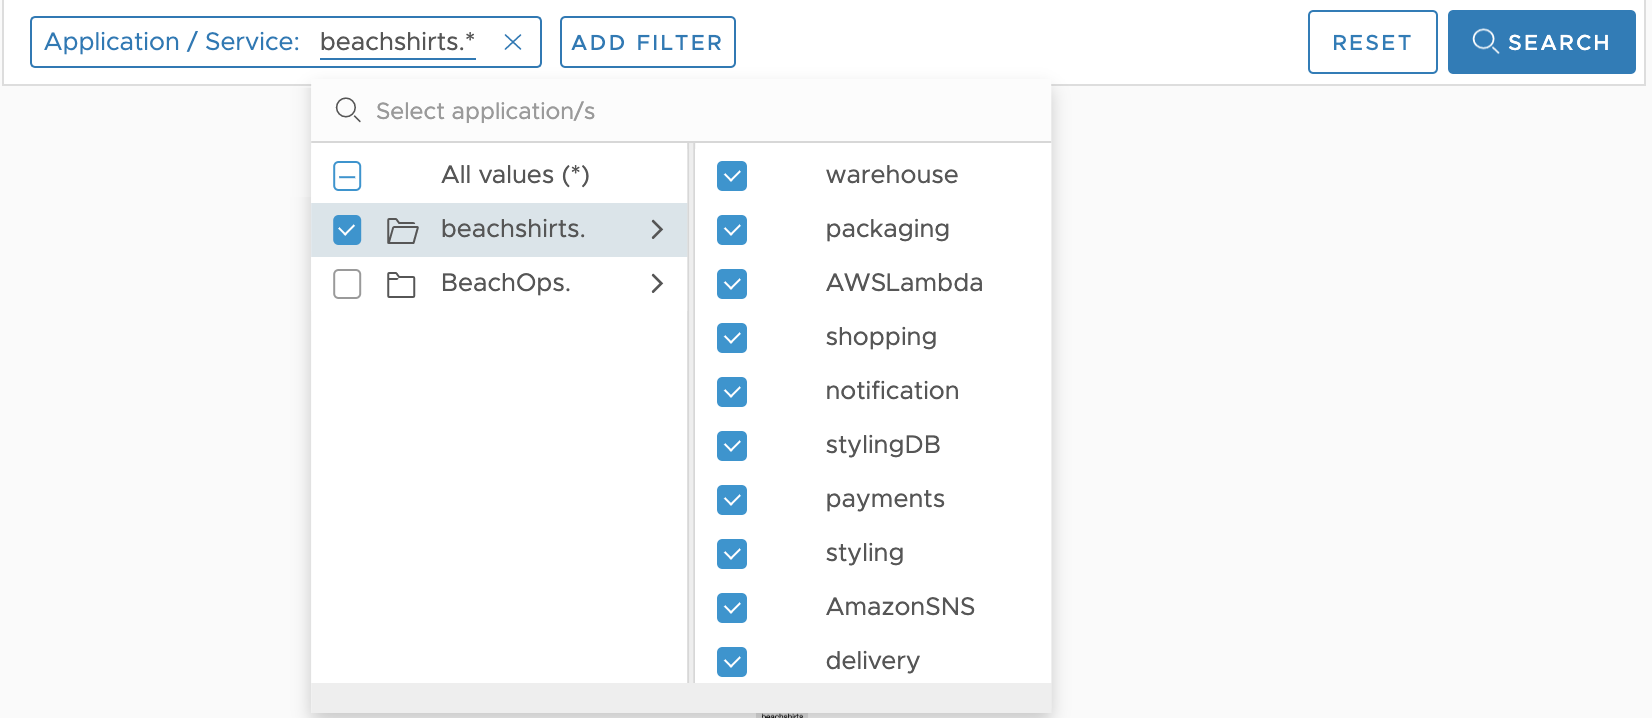
Step 1: Search for applications Click Application/Service, select beachshirts, and click Search. You can refine your search further by applying one or more filters, such as the cluster, shard, or span.kind. You see the data that match your search filters and the nearest neighboring service. For example, if you filter for the beachshirts application's styling service, you only see the services that directly communicate with the styling service. |
|
|
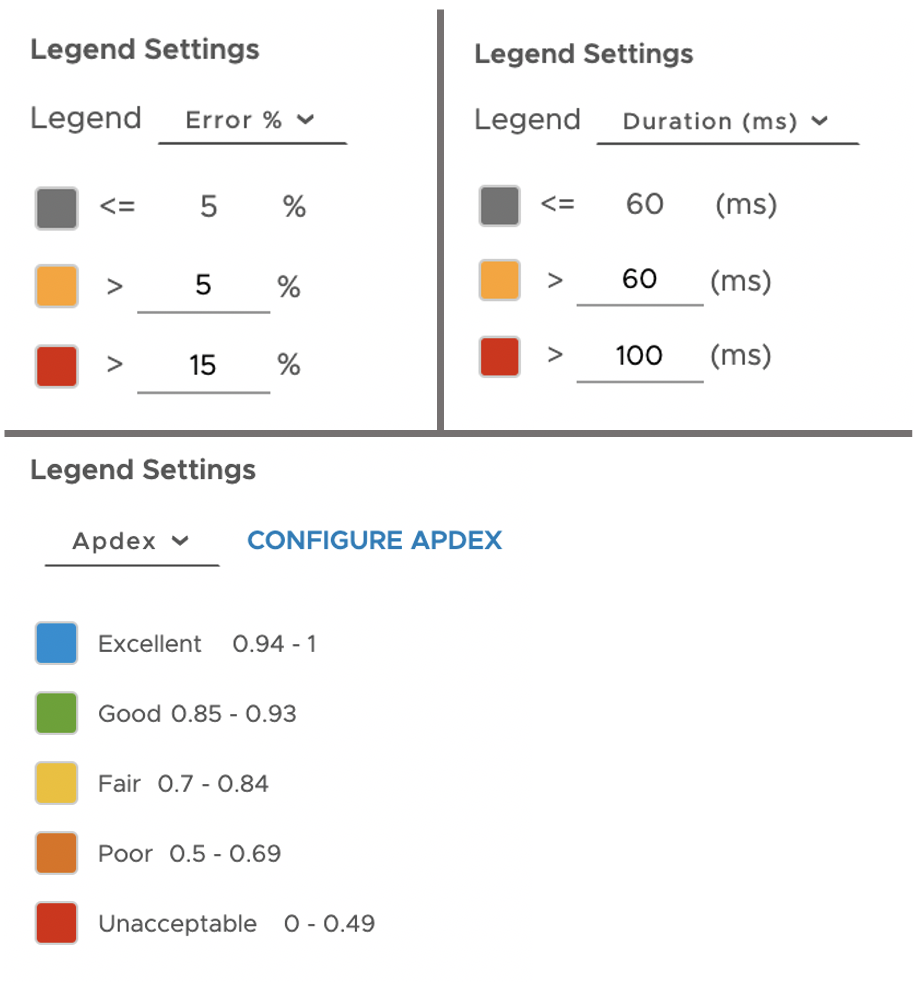
Step 2: Update the legend Click the settings icon and select Apdex, Error, or Duration. These settings can be configured by each user and apply to the table view, and grid view too.
|
|
|
Step 3: Customize the application map view You can customize how you see your applications and services on the application map using the settings icon.
|

|
|
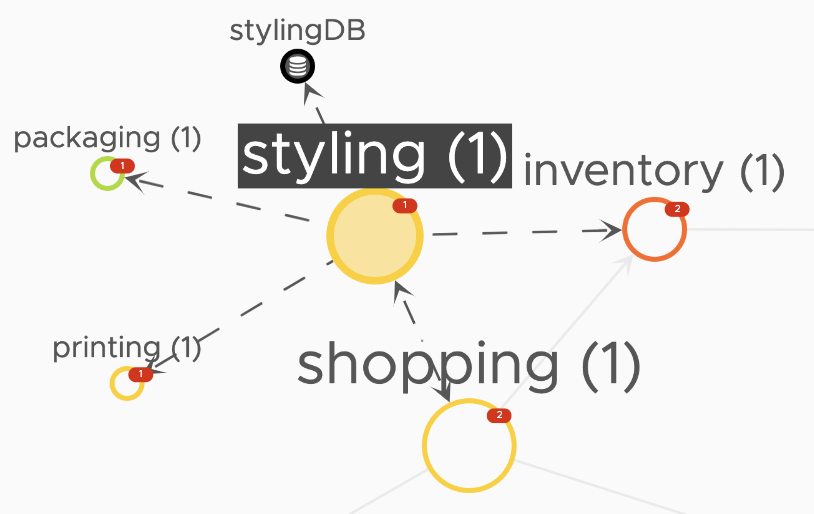
Step 4: Hover over a service Hover over the styling service of the beachshirts application. It highlights how the styling service communicates with the other services in the application. |
 |
|
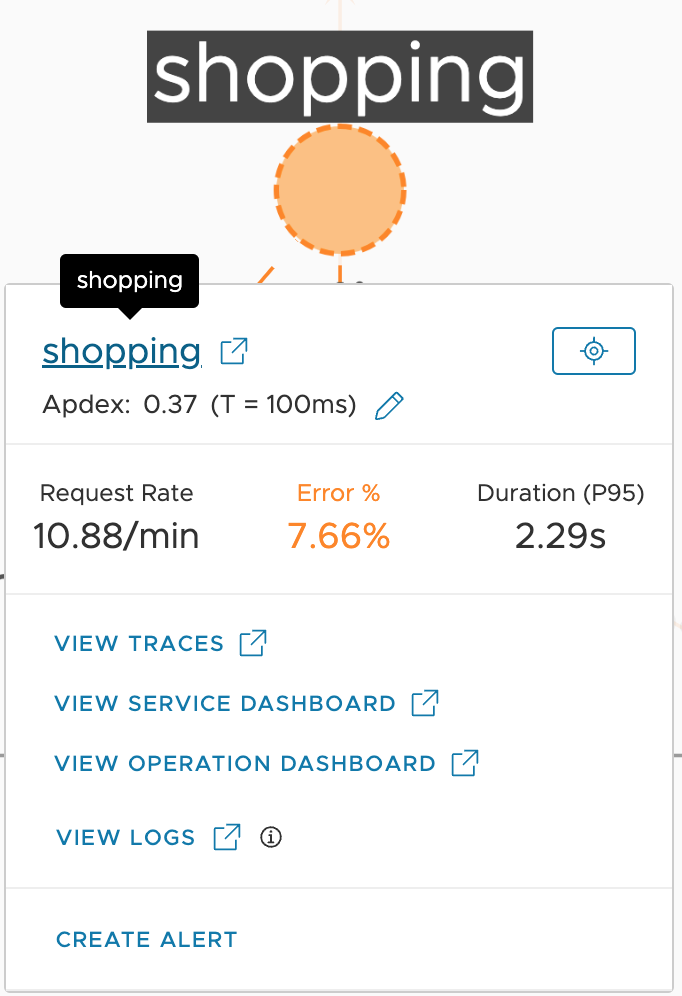
Step 5: Click on a service
Click on the styling service. Now, you can:
|
 |
|
Step 6: Focus on a service Click on a service and then click Focus on service to focus on the styling service of the beachshirts application. This will help you focus on a specific service when you have many services in your application. |
 |
|
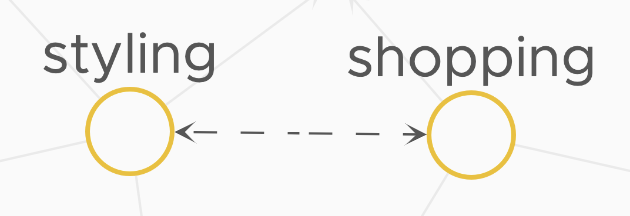
Step 7: Hover over a tracing traffic Hover over the tracing traffic between the styling and shopping service. You see that they send requests to each other. When you hover over a tracing traffic (the arrow that goes from one service to the other). It highlights the direction of the requests between the two services. Tracing traffic is bidirectional if the two services send requests to each other. |
 |
|
Step 8: Click on a tracing traffic
When you click on the tracing traffic between the styling and printing service, you can:
|
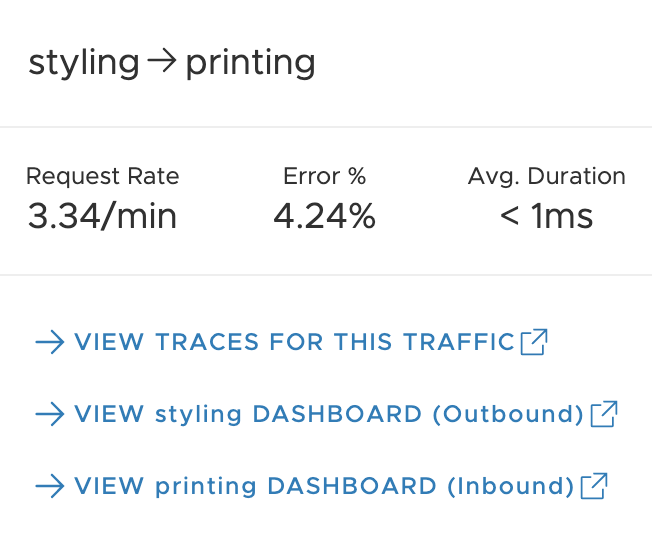 |
Table View Features
View the list of applications and services. You can see the Request, Error, and Duration (RED) metrics at a glance and sort the data.
See the table view:
- Log in to your service instance.
- From the toolbar, select Applications > Application Status and click the Table View icon (
 )
)

Using the table view, you can:
- Examine the applications and services, or search for a particular application or service by applying filters.
You can refine your search further by applying one or more filters, such as the cluster, shard, or span.kind. - Click the name of the service to drill down to the Service Dashboard.
- Sort data:
- Sort the application and service names alphabetically.
- Sort the table in the ascending or descending order of the RED metrics.
- See the change (Δ value) in the RED metrics based on the time you selected for Compare.
For example, if you select week ago from the Compare drop-down, the Δ value indicate the change in RED metrics since the data was recorded a week ago.
- Click the vertical ellipsis > Create Alerts to create smart alerts that filter noise and capture true anomalies. See Create an alert.
- Click the vertical ellipsis > View Alerts to view alerts that are firing for the service. The number of alerts firing for the service are shown on the Alerts column.
- Inspect the Apdex score and RED metrics to obtain a status summary of a service.
Table Data Description Apdex Shows you how the response time of a service compares to the predefined response time threshold. Apdex Threshold The threshold Apdex threshold of the service. The default threshold value is set to 100ms, and only Super Admin users and users with the Applications permission can configure the threshold (T). Request Rate The request rate of the service. Δ Request Rate The difference between: - The current request rate
- The request rate at the Compare option time.
Error % The percentage of the service's spans that contain errors. Δ Error % The difference between: - The current error percentage
- The error percentage at the Compare option time.
Duration (P95) The span duration at the 95th percentile across the service. Δ Duration (P95) The difference between: - The current duration (P95)
- The duration (P95) at the Compare option time.
Component See the components used by the service. For example, the beachshirts application's styling service uses the Java, Dropwizard, and Jersey components. -
Use
to get a link and share what you’re seeing right now (NON-LIVE display) with other users. - Update the legend by clicking the settings icon. These settings can be configured by each user and apply to the application map, and grid view too.
Error Percentage
Update the legend to highlight the data based on the error percentage. Select Error % from the dropdown and customize the values. The values need to be in ascending order.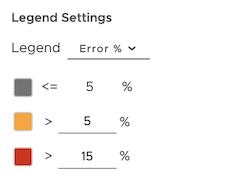
Duration
Update the legend to highlight the data based on the duration. Select Duration from the dropdown menu and customize the values. The values need to be in ascending order and in milliseconds.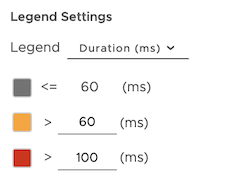
Apdex
Update the legend to highlight the data based on the Apdex score. Select Apdex from the dropdown menu. Only Super Admin users and users with the Applications permission can configure the threshold (T).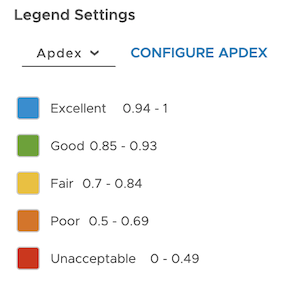
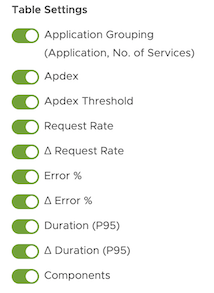
- Click the settings icon to customize the table view:
- Group the services by the application or ungroup the services.
- Add or remove columns by selecting or deselecting items from the table settings options.
- View specific alerts for a service:
Click the settings icons and select the severity of the alert you want to see on the application map under Alert Settings. For example, if you select Severe, you see the alerts that have the severity status set to severe marked with a red dot on the application map. 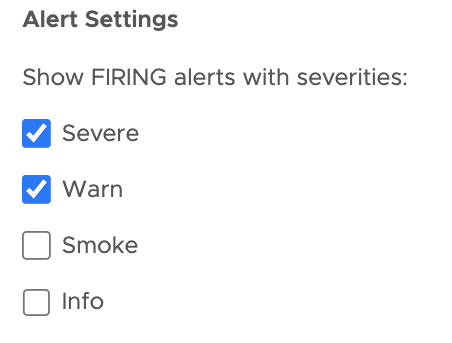
Grid View Features
When you select an application, you get an overview of its services.
See the grid view:
- Log in to your service instance.
- From the toolbar, select Applications > Application Status and click the Grid View icon (
 )
)
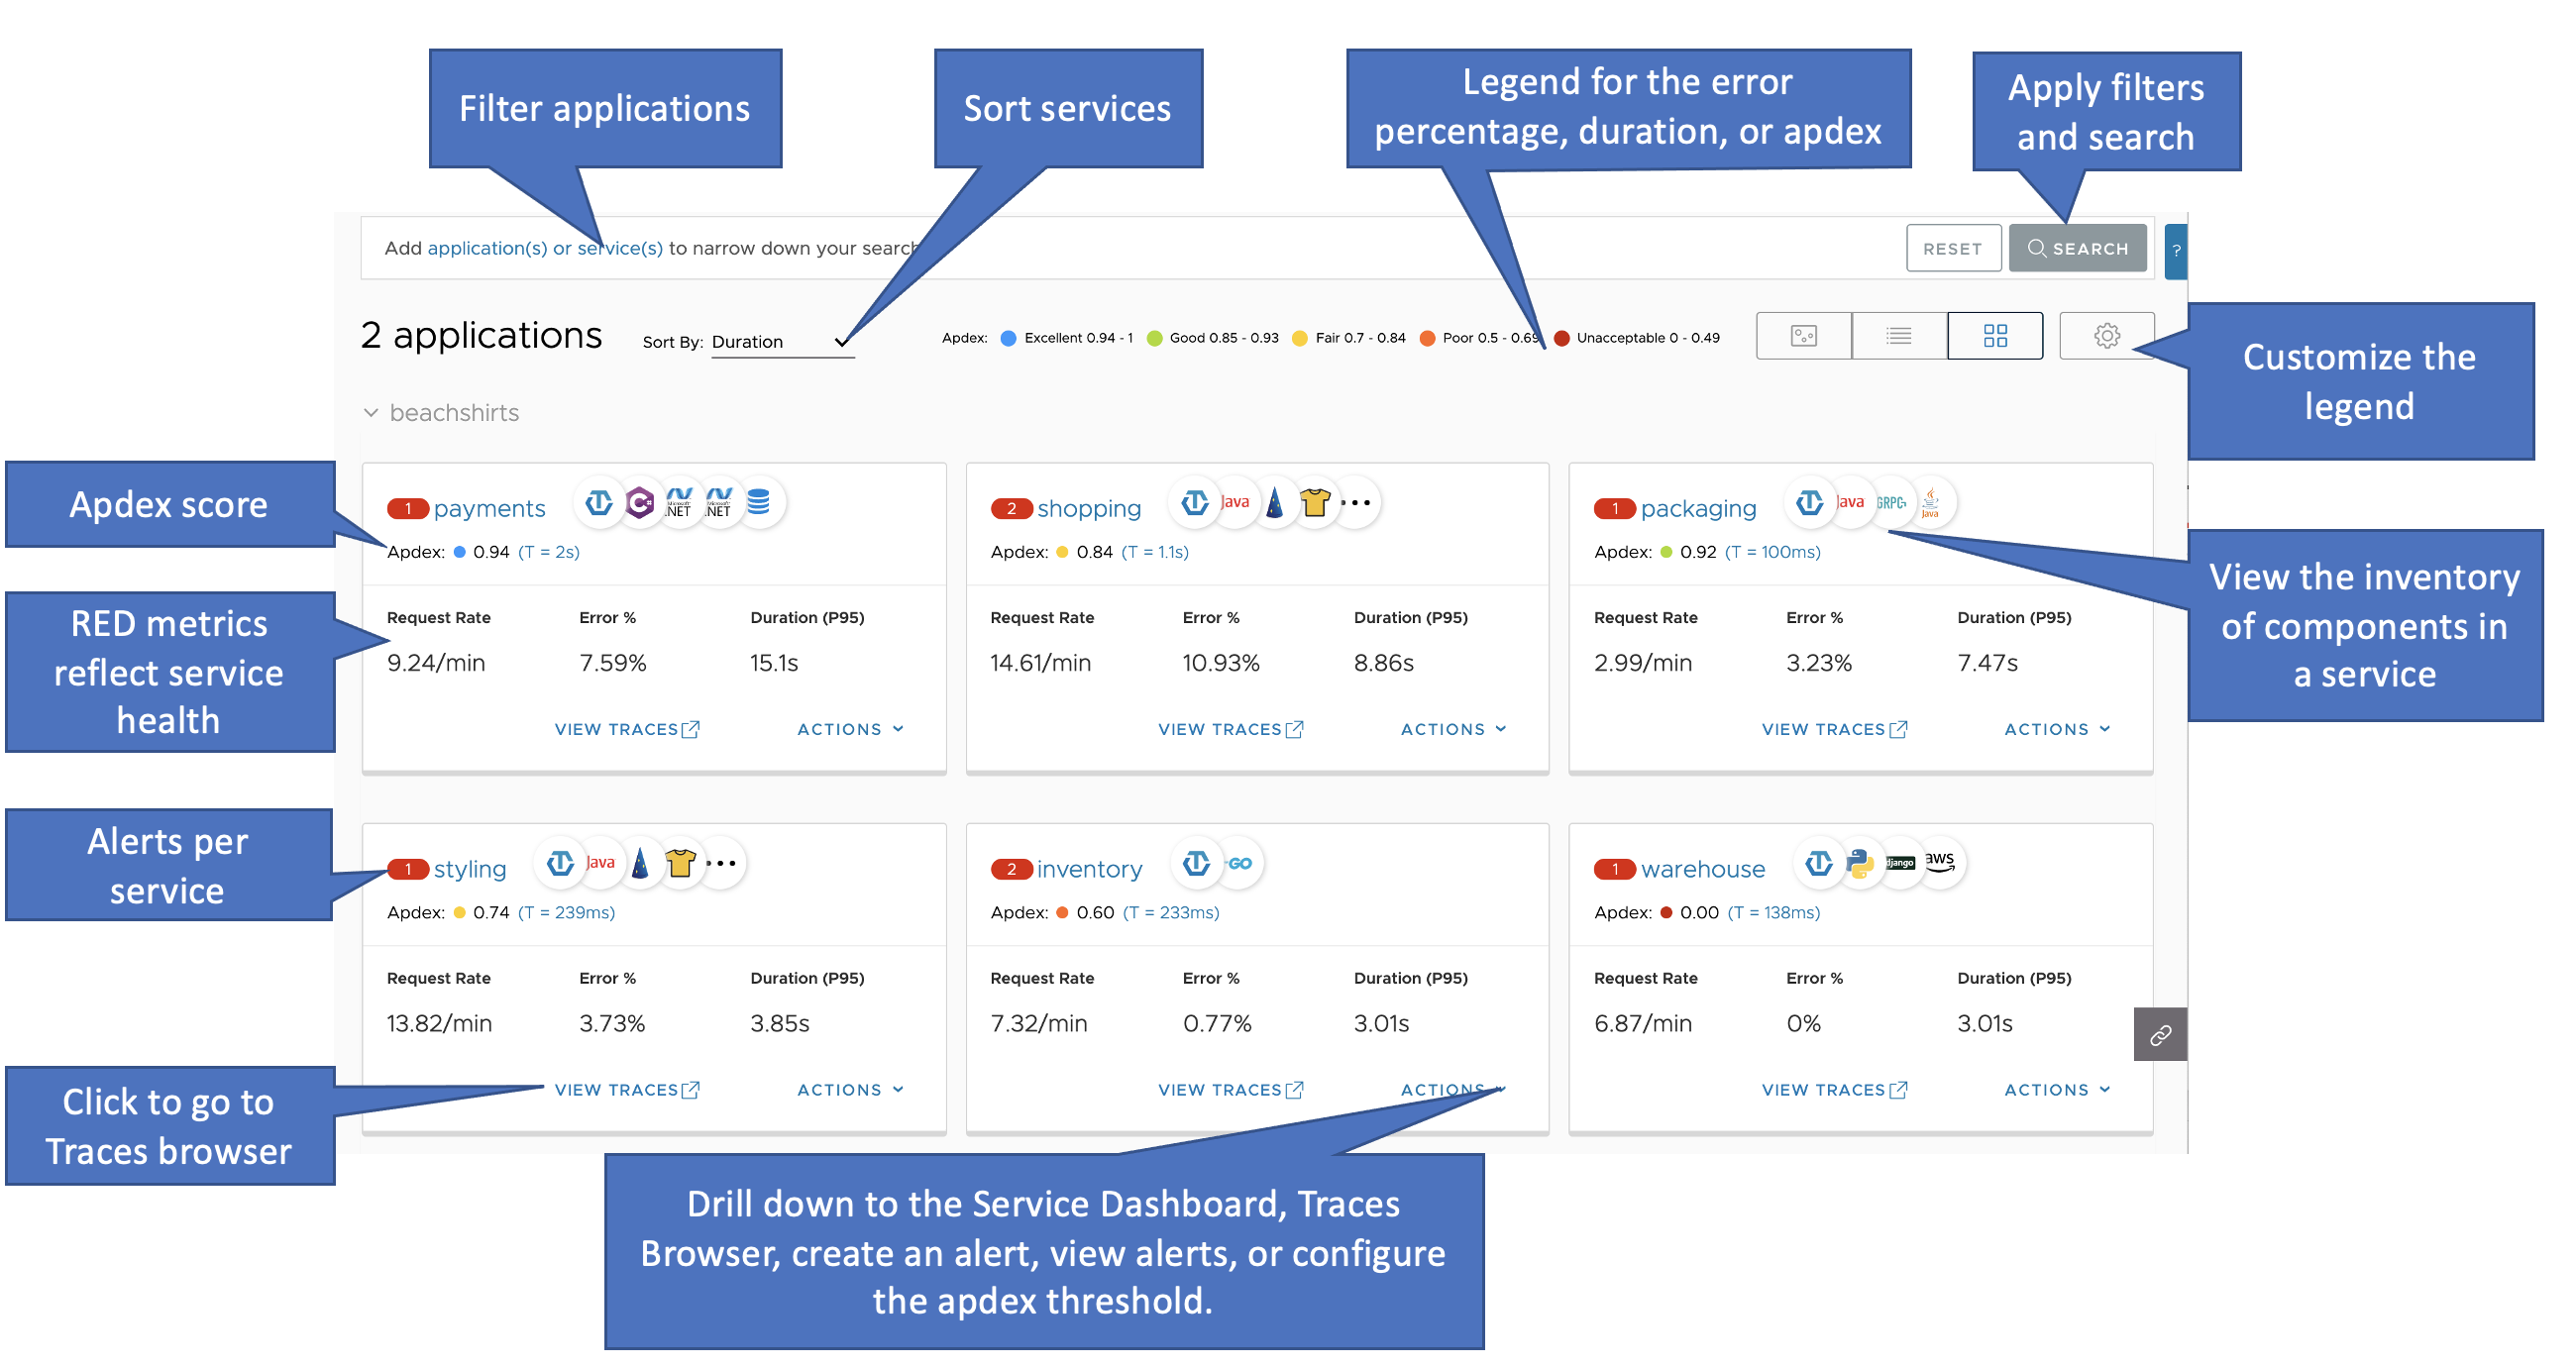
On the page for a particular application, you can:
- Examine the services in the application, or search for a particular service by applying filters.
You can refine your search further by applying one or more filters, such as the cluster, shard, or span.kind. - View the inventory of component frameworks that each service is built on.
- Inspect RED metrics to obtain a status summary for a service:
- The request rate of the service.
- The percentage of the service’s spans that contain errors.
- The span duration at the 95th percentile across the service.
- Click Actions > Create Alerts to create smart alerts that filter noise and capture true anomalies. See Create an alert.
- Click Actions > View Alerts to view alerts that are firing for the service. The number of alerts firing for the service are shown on the red circle next to the service name.
- Drill down from a service box:
- Click the name of the service or Details to explore the dashboard for that service.
- Click All Traces to explore the traces that originate in that service.
- Update the legend by clicking the settings icon. These settings can be configured by each user and apply to the application map, and table view too.
Error Percentage
Update the legend to highlight the data based on the error percentage. Select Error % from the dropdown and customize the values. The values need to be in ascending order.
Duration
Update the legend to highlight the data based on the duration. Select Duration from the dropdown menu and customize the values. The values need to be in ascending order and in milliseconds.
Apdex
Update the legend to highlight the data based on the Apdex score. Select Apdex from the dropdown menu. Only Super Admin users and users with the Applications permission can configure the threshold (T).
- View specific alerts for a service:
Click the settings icons and select the severity of the alert you want to see on the application map under Alert Settings. For example, if you select Severe, you see the alerts that have the severity status set to severe marked with a red dot on the application map.
Create Alerts
Our smart alerts capture true anomalies and filter noise. You can:
- Specify one or more alert targets that receive the alert notification(s).
- Create a multi-threshold alert to notify different targets depending on alert severity.
- View an image of the chart in the alert notification and click a link to see the alert in context.
- Examine firing alerts in Alert Viewer to get context.
Create an alert from the application status page:
- Navigate to the app map, table view, or grid view:
App map view:
Click on a service > Create Alert.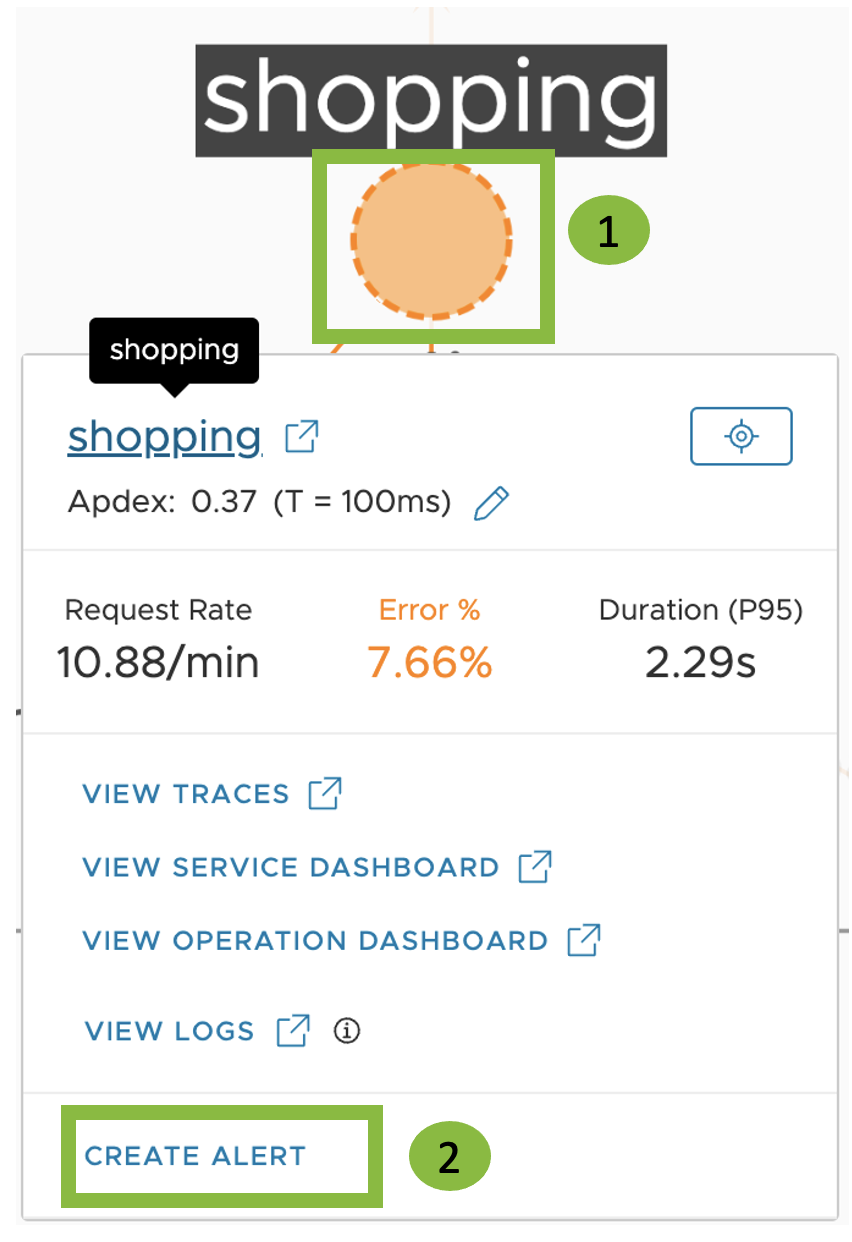
Table view:
Click the vertical ellipsis > Create Alert.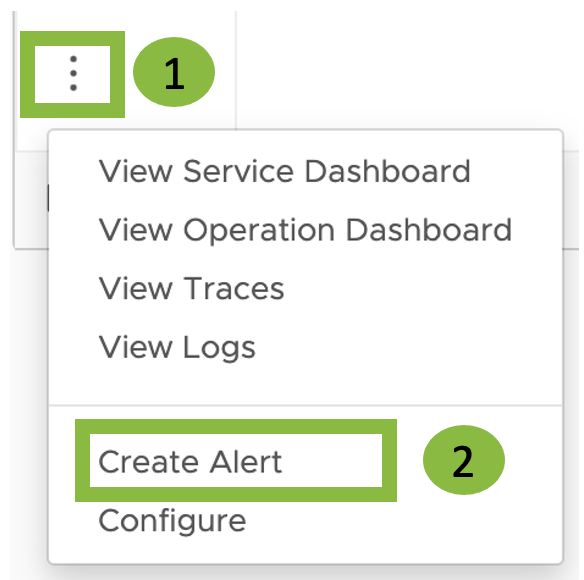
Grid view:
Click Actions > Create Alert.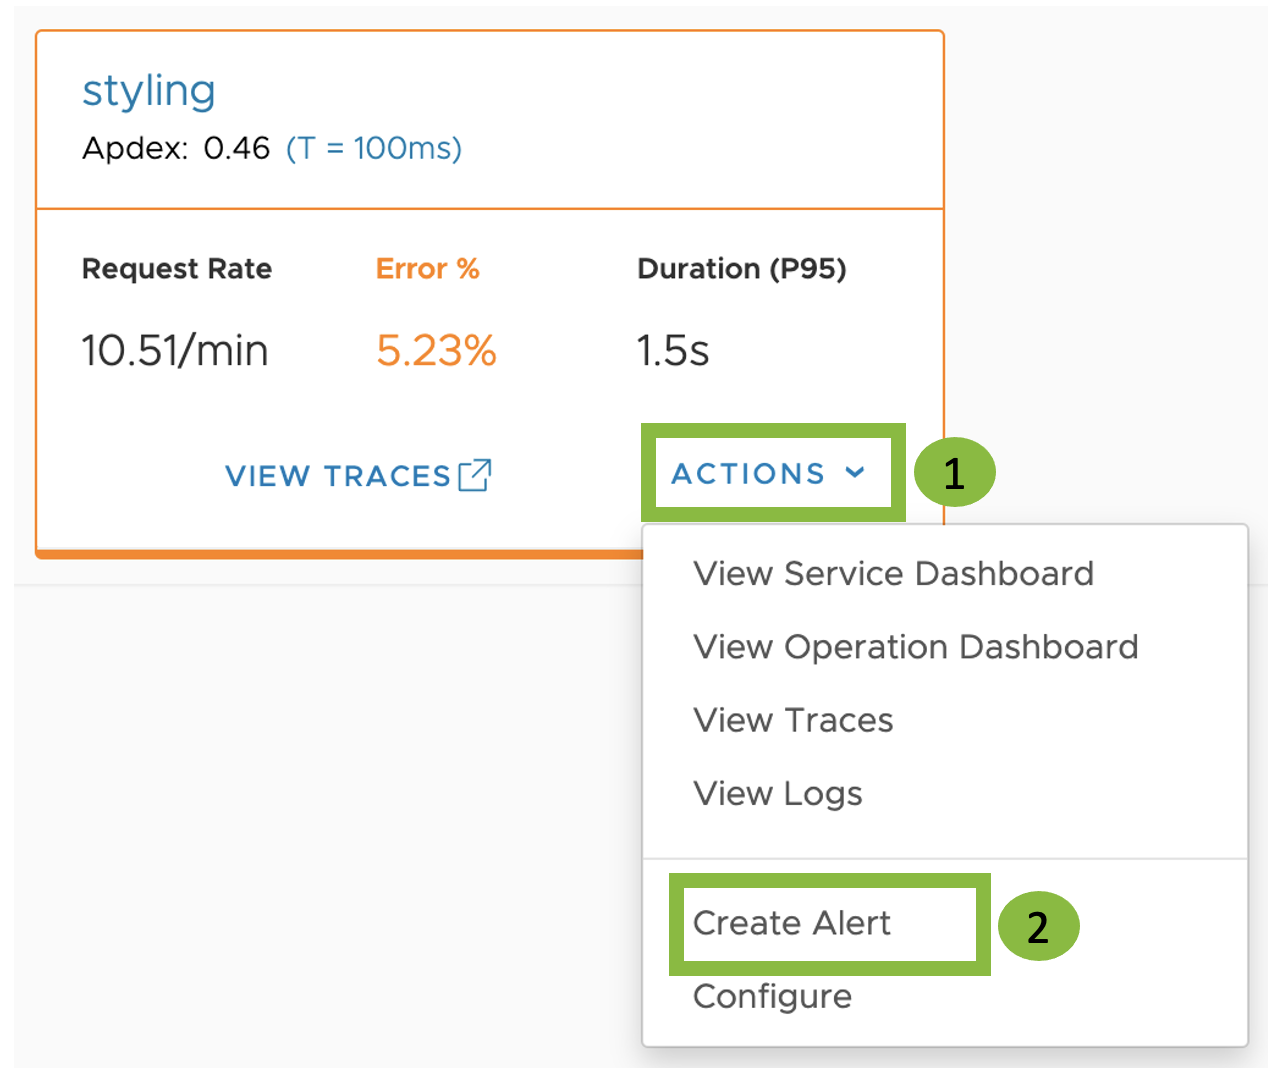
- Configure the alert:
- You can set the alert conditions based on your data. For example, let’s create an alert that fires in the:
- Severe state for the shopping service when the error percentage is greater than 6%
- Warn state when it is greater than 3%. See Create and Manage Alerts for details.
- Create an alert target to receive alert notifications for a variety of messaging platforms (email, pager services) and communication channels.
You can also customize your alert targets to include a link to a service dashboard when the alert fires. - Optionally, use alert tags to organize related alerts into categories.
- You can set the alert conditions based on your data. For example, let’s create an alert that fires in the:
- Click Create Alert.
Once the alert is created, click Alerting > All Alerts and search for the alert you created .
Drill into Logs from Traces
If you have the Logs permission, you can drill into logs from the application status page and the Traces Browser.
When you notice that a service on the application map, table view, or grid view has a high error percentage, you can drill down into the related logs.
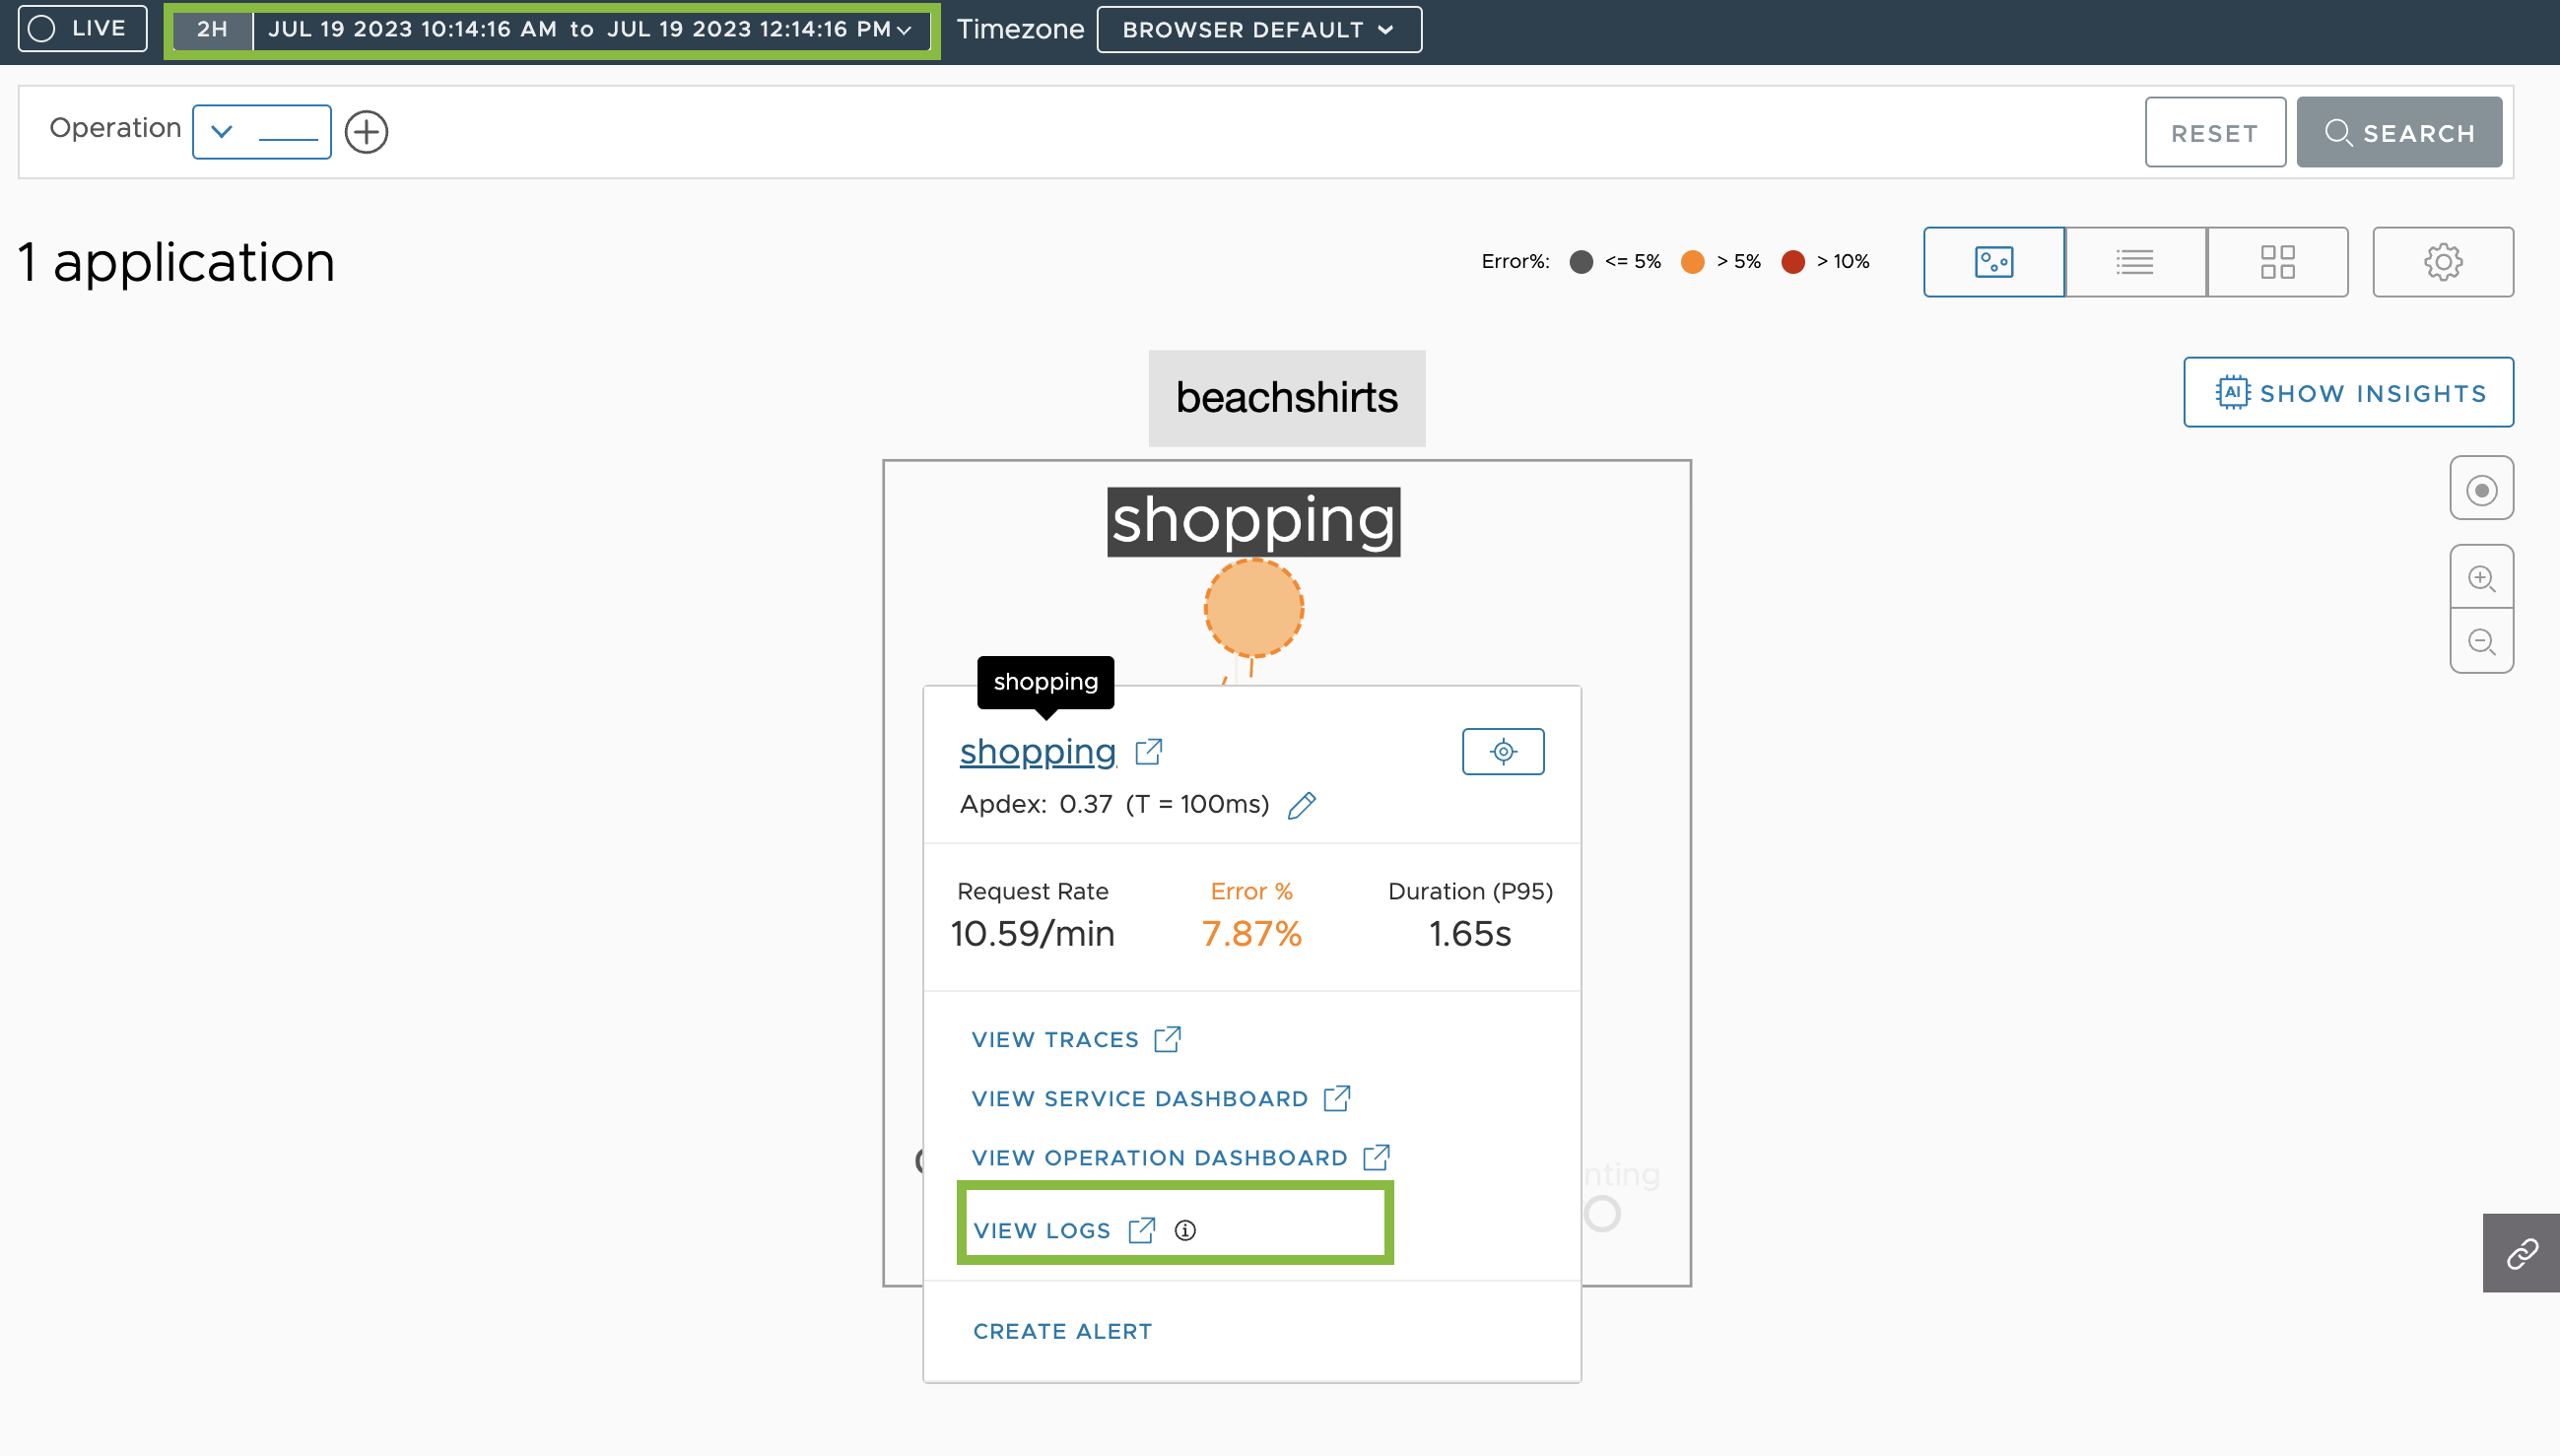
- From the Map View
- Select the time window of interest.
- Click the service on the application map.
- Select View Logs.
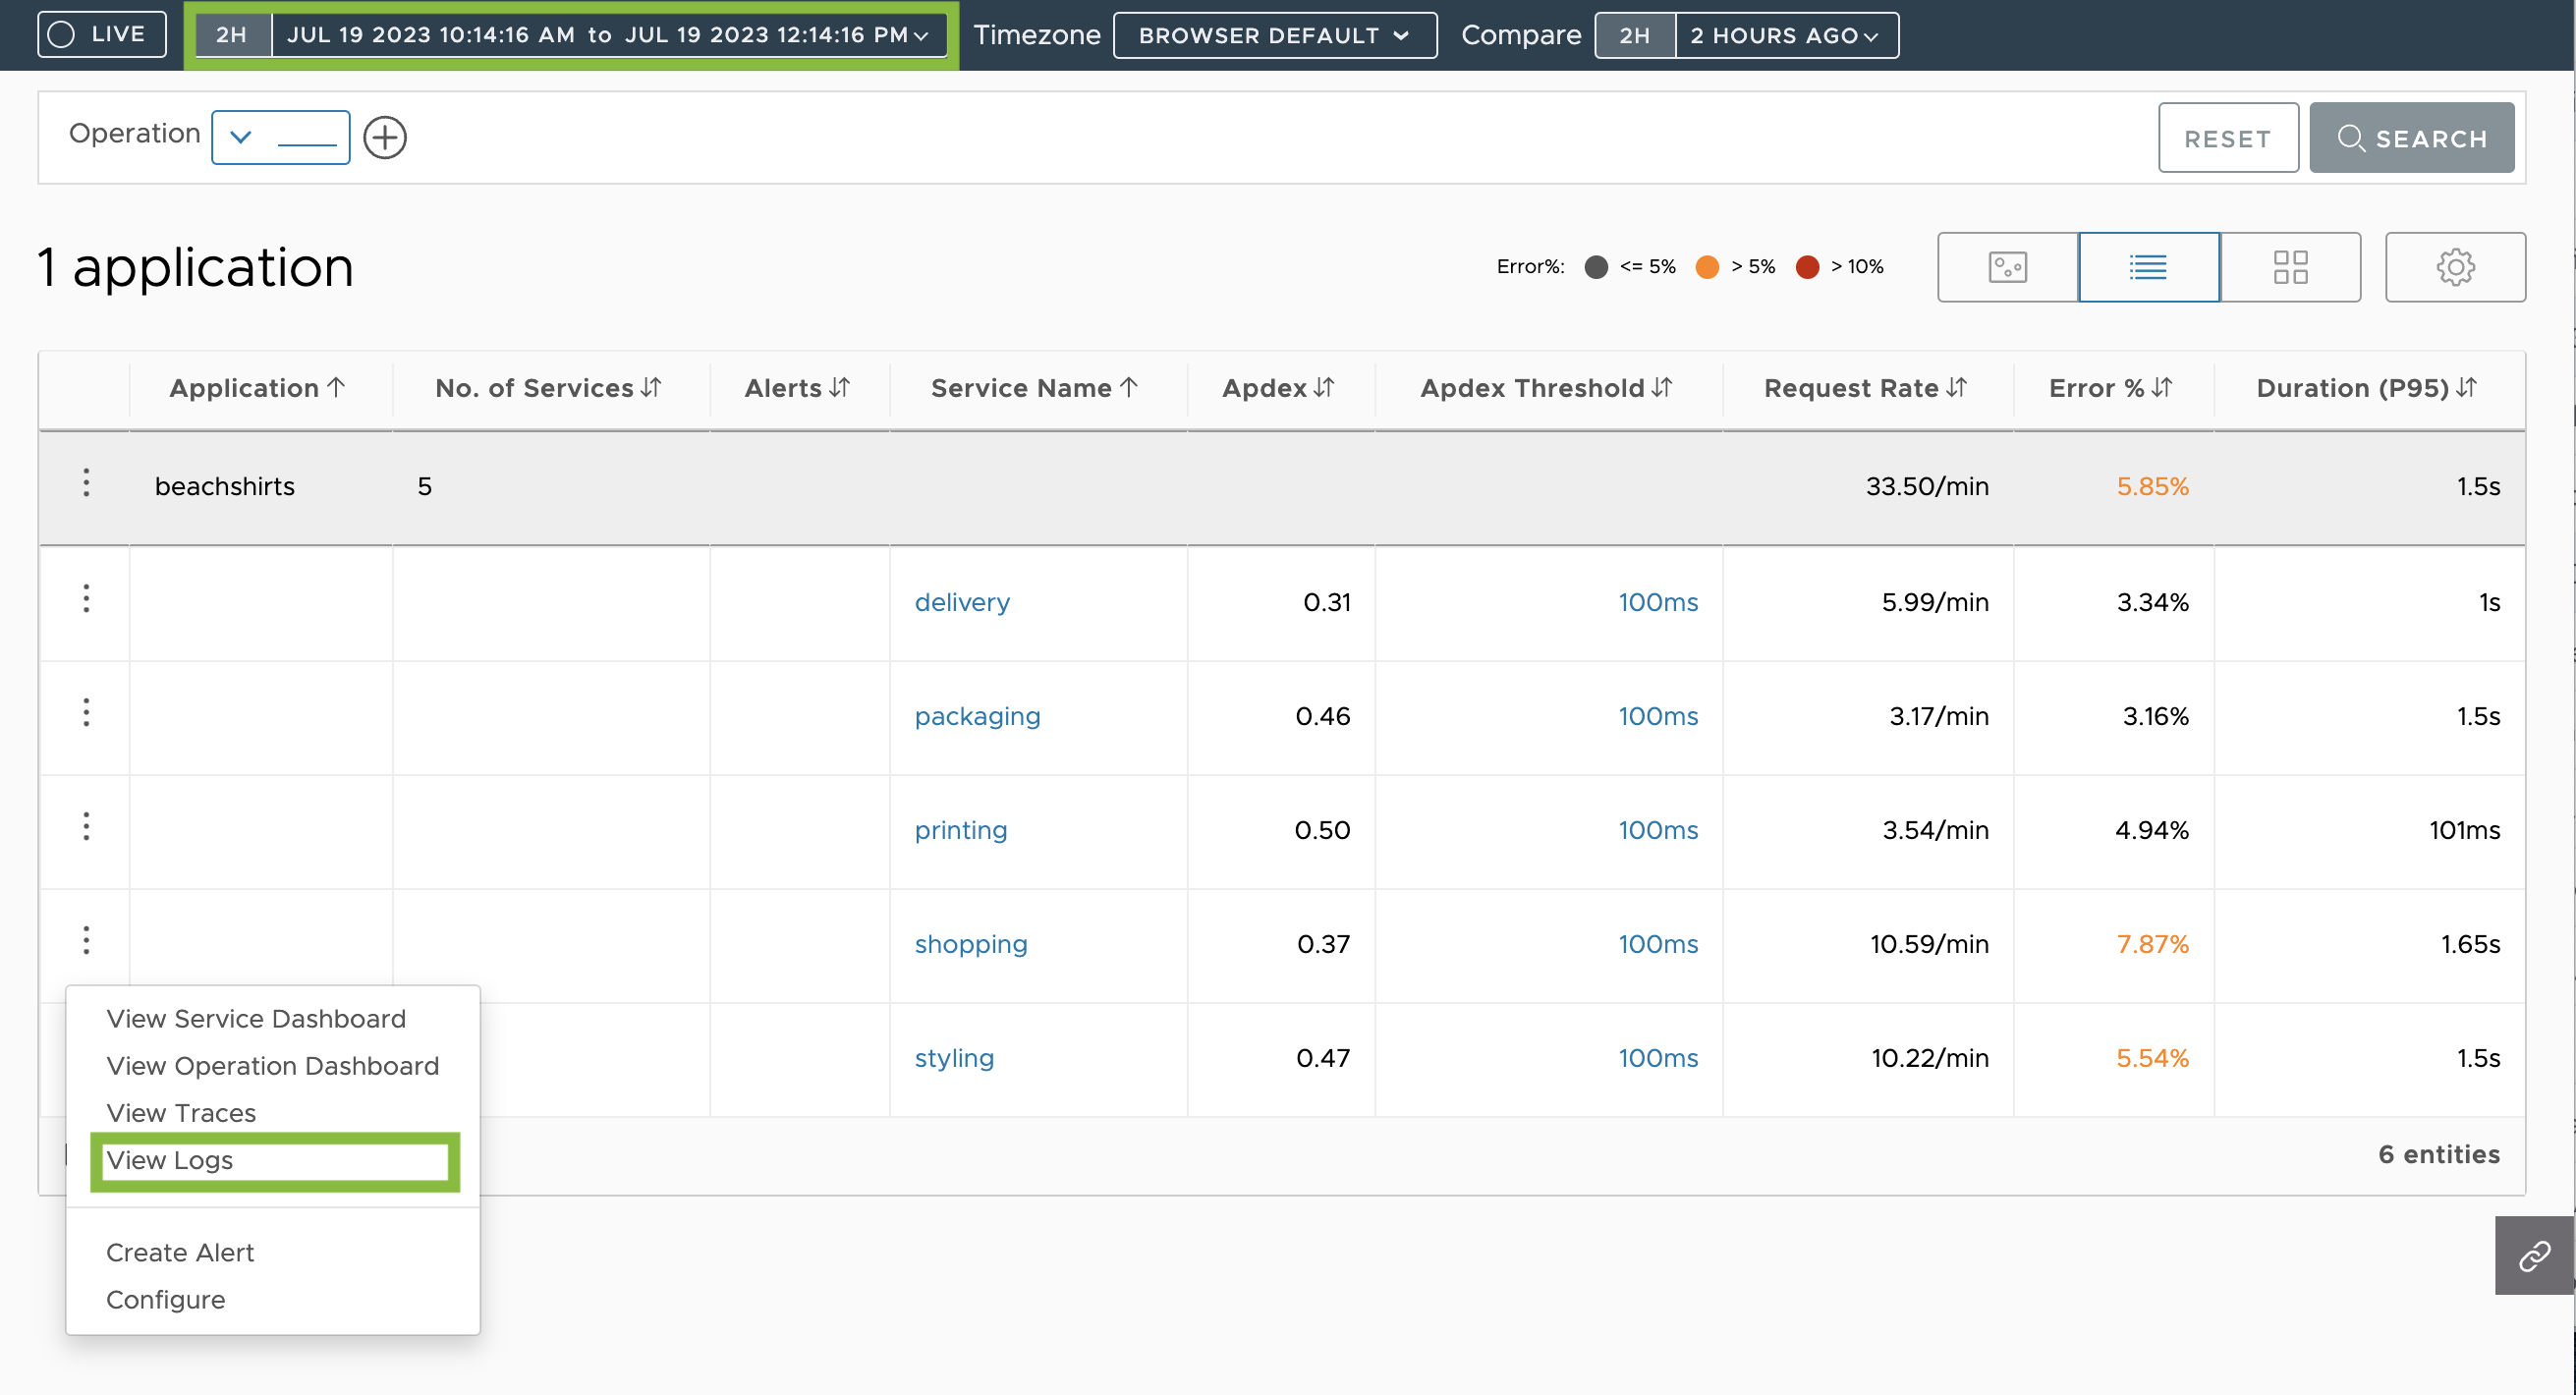
- From the Table View
- Select the time window of interest.
- Click the ellipsis for the service.
- Select View Logs.
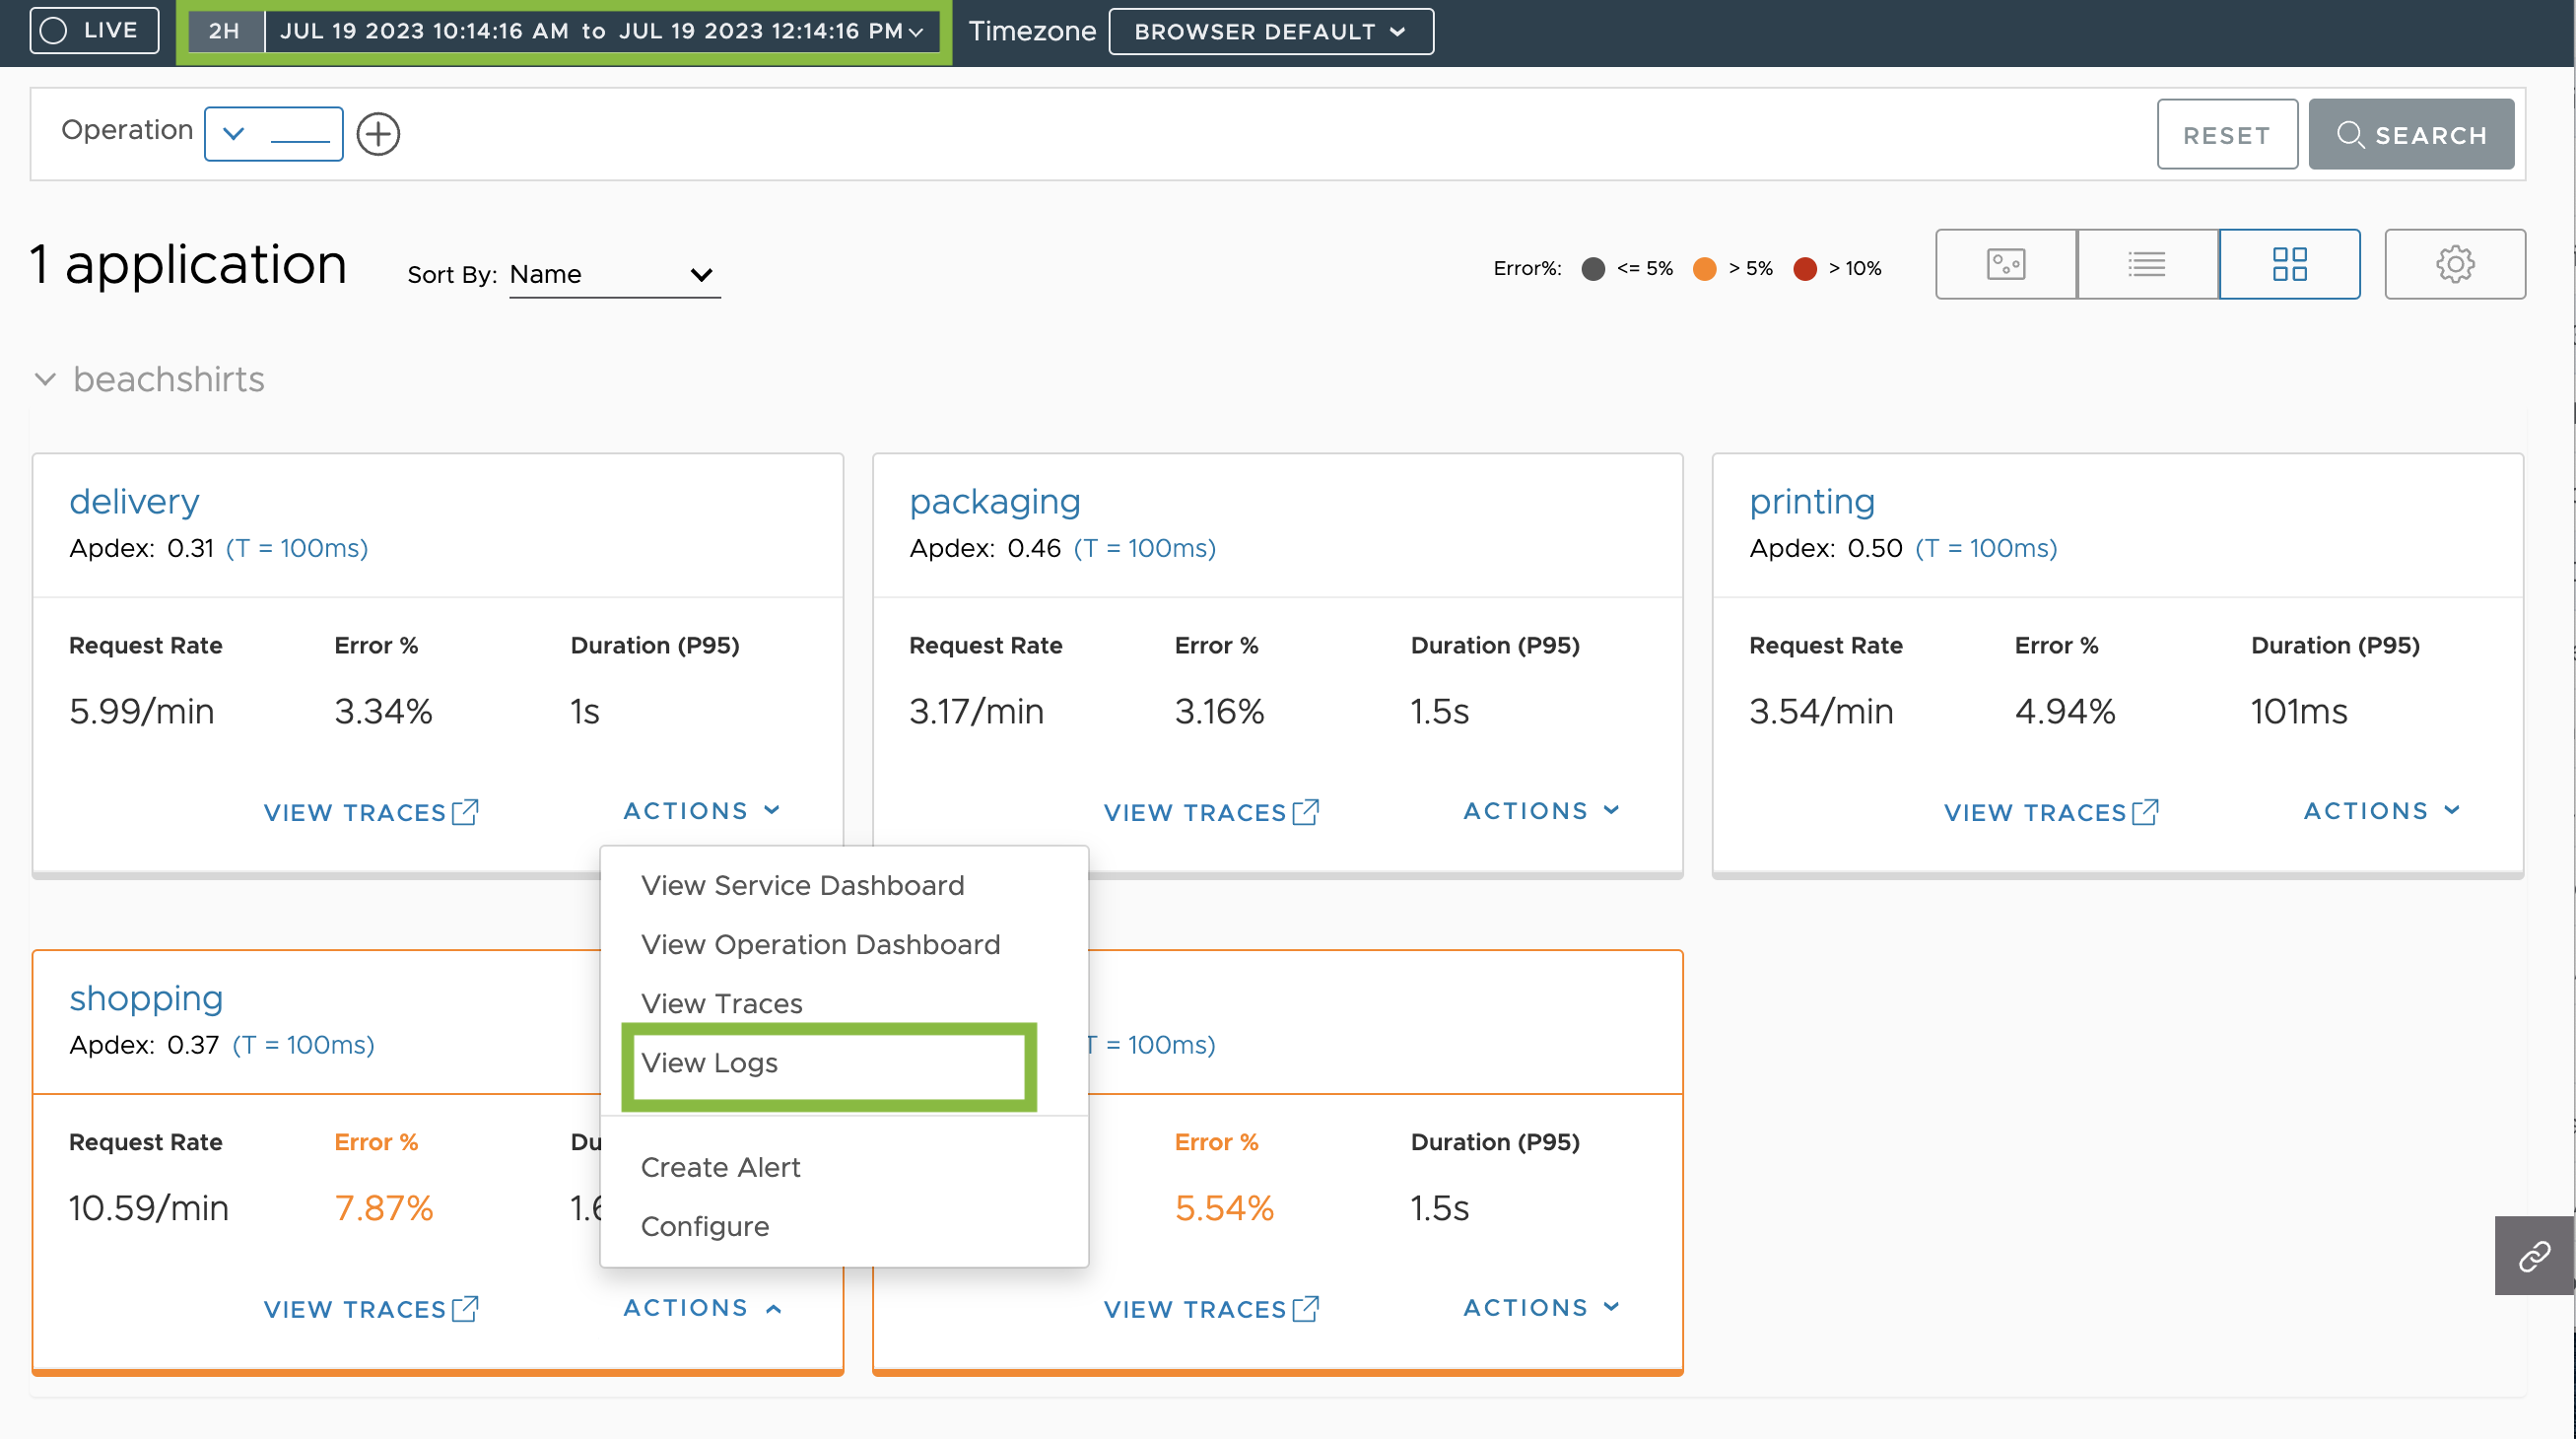
- From the Grid View
- Select the time window of interest.
- In a service tile, click Actions.
- Select View Logs.
The Logs Browser opens in a new tab with the following configurations:
- The search time window corresponds to the time window on the Application Status page.
- The search query contains the corresponding
serviceandapplicationtag filters.