When an alert in VMware Aria Operations for Applications (formerly known as Tanzu Observability by Wavefront) changes state, it sends notifications to one or more alert targets. Each notification contains information extracted from the alert about its state change. By default, the notification includes a static alert image and a link to the alert chart in Alert Viewer.
Where and When Notifications Are Sent
The type of alert (single-threshold or multi-threshold) and the type of alert target (simple or webhook-based) determines the notification behavior.
Where the notification is sent depends on the type of alert.
- For multi-threshold alerts, each alert target has an associated severity. The notification is sent to the target(s) that were associated with that severity and all higher severities.
Note: Alert targets subscribe to all notifications at their severity and above. For example, an alert target for an INFO severity receives all notifications for INFO, SMOKE, WARN, and SEVERE. Because notifications potentially go to targets of different severities, you cannot associate an alert target with more than one severity.
- For single-threshold alerts, which have just one severity, the notification is sent to all targets and includes the severity that is associated with the change.
When the notification is sent depends on the type of alert target:
- For simple targets (email addresses and PagerDuty keys added directly in the alert’s Recipient List), a notification is sent whenever the alert is firing, updated, resolved, snoozed or in a maintenance window.
Note: A maximum of 10 email targets is supported. For multi-threshold alerts, the maximum is 10 email targets per severity.
- For custom alert targets, a notification is sent in response to each triggering event. Triggering events are specified as part of alert target creation.
What’s in an Alert Notification
How an alert notification looks depends on where you look at it. This section discusses the basics by looking at an email alert notification as an example.
Link to Interactive Chart in Alert Viewer
Each alert notification includes a link to an interactive chart, usually through a View Alert button. Interactive charts enable you to investigate your data by performing additional queries, changing the time window, and so on.
- Simple notification emails include a View Alert Chart link that takes you to the chart view.
- For PagerDuty, alert target (webhook), and templated email notifications:
- The
urlmustache template variable directs to the Alert Viewer. - The
chartUrlmustache template variable directs to the chart view.
- The
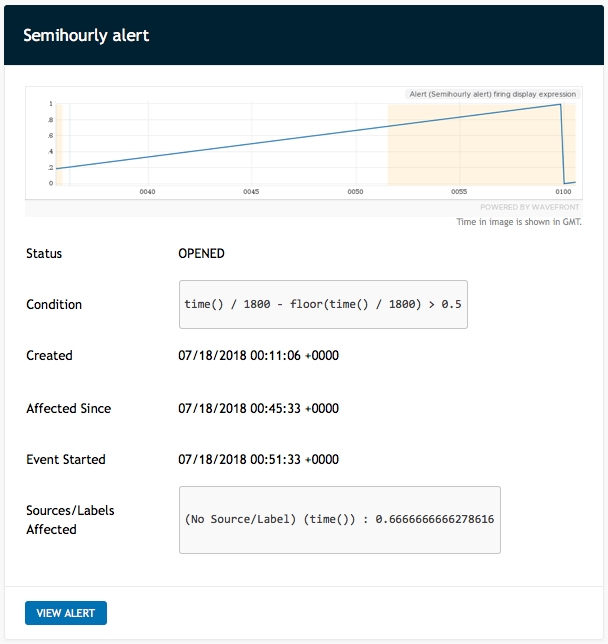
The sample email notification in the screenshot above includes a View Alert button that users can click to go to the URL and see an interactive chart in Alert Viewer
Alert Condition Information
The interactive chart that is included in the notification shows the alert condition.
Misfiring Alerts and Delayed Data
I data were delayed and then backfilled, you might see the data in the chart but it’s possible they were not available to the alert engine at an earlier time. Misfiring alerts are the result.
The interactive chart is set to the time window in which the alert was triggered. However, the data in the chart might have been backfilled with data values that were reported during that time window, but were not ingested until later.
If you suspect a misfiring alert, inspect the chart image that is included in the notification. The chart image shows a snapshot of the state when the alert fired, instead of the chart image.
Optional Information in the Interactive Chart
Depending on the state change that triggered the alert, the interactive chart might display additional information:
- <Alert name> - The display expression if one was specified. Otherwise, alert the condition expression.
- Alert Condition - The alert condition
- Alert Firings - An events() query that shows system events of type
alertfor the alert. These events occur whenever the alert is opened. The query shows both the current firing (an ongoing event) and any past firings (ended events). - Alert Details - An events() query that shows events of type
alert-detailfor the alert. These system events occur whenever the alert is updated (continues firing while an individual time series changes from recovered to failing, or from failing to recovered).
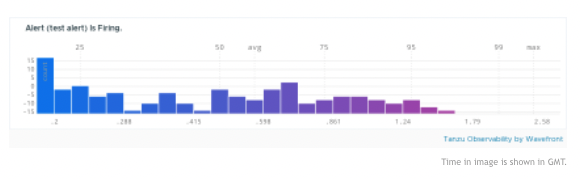
Static Chart Image in Notifications
When an alert starts firing or is updated, the resulting alert notification includes a snapshot of the chart that shows data at the time the alert was triggered. Chart image creation usually takes a few seconds, so you might briefly see a placeholder in the notification. For performance reasons, a chart image is included only if the alert condition query takes a minute or less.
In the sample email notification above the following chart image is at the top:
The alert chart image is different from what you see in Alert Viewer when you click View Alert because the time is different.
- The chart image shows the state of the data that caused the alert to fire. This snapshot might be helpful for diagnosing a misfiring alert.
- The interactive chart that the notification links to shows the data at the time you bring up the chart. This chart might include data that was backfilled after a delay.
See Limiting the Impact of Data Delays for some background.
Automatic and Explicit Chart Image Inclusion
Chart images are automatically included in notifications for:
- Simple alert targets (email addresses and PagerDuty keys that are added directly in the alert’s target list).
- Custom alert targets for PagerDuty notifications.
- Predefined templates for custom HTML email targets and for Slack targets.
You can explicitly include chart images in notifications for custom alert targets.
For custom alert targets created before release 2018-26.x you must edit the alert target’s template to include chart images in notifications.
How to Exclude Chart Images
If you want to exclude chart images:
- Remove the corresponding variable from the templates for custom HTML email or Slack targets.
- You cannot remove chart images for custom PagerDuty alert targets.
PagerDuty Notifications
If you use the out-of-the-box PagerDuty alert target, and you resolve the incident in PagerDuty while the alert is still firing in Operations for Applications, two scenarios are possible:
-
If there is a change to the set of sources being affected, that change triggers a new incident in PagerDuty. Changes to the set of sources being affected include:
- Newly affected sources are added to the list of existing affected sources
- A subset of the existing sources being affected is no longer affected
-
If all affected sources are no longer affected and the alert is resolved in Operations for Applications, then no new incident is logged into PagerDuty.
You can customize this behavior by creating a custom PagerDuty alert target with different triggers.
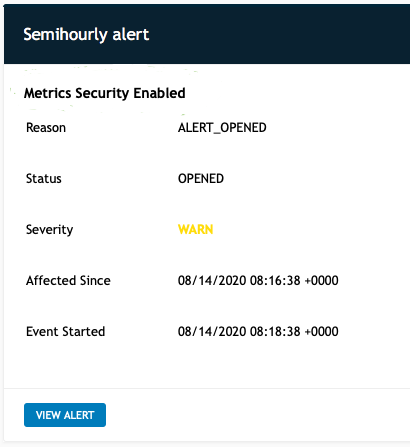
Alert Notification with Secured Metrics Details
If Secure Metrics Details is selected for an alert, the email or Slack notification:
- Includes the text Metrics Security Enabled at the top.
- Does not include metric details and alert images.
When you select Create Alert and Edit Alert you can select a Secure Metrics Details check box. Here’s how it works:
- Alerts always check the complete set of metrics.
- When a user opens alert-related charts,
- Metrics protected by metrics security policy rules are not displayed.
- A notification that some metrics are hidden due to metrics security policies is shown on the chart.