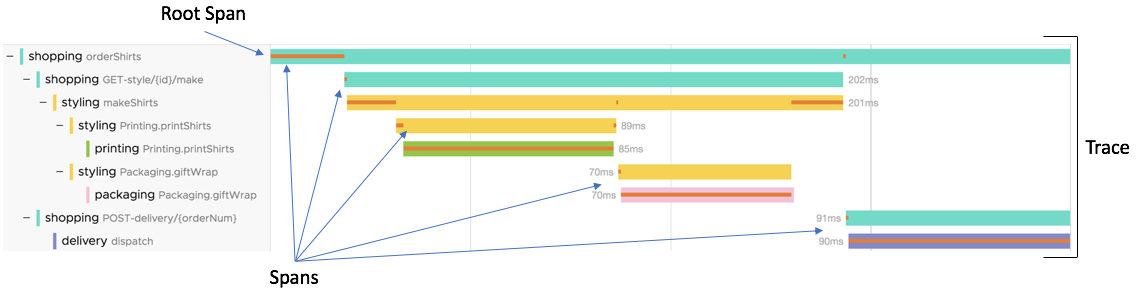
Traces
A trace shows you how a request propagates from one microservice to the next in a distributed application. The basic building blocks of a trace are its spans, where each span corresponds to a distinct invocation of an operation that executes as part of the request.
This diagram illustrates a trace for a particular request that started with the Shopping service’s orderShirts request and finished with the Delivery service’s dispatch request.
-
This trace consists of 9 member spans, one for each operation performed in the request. The span for the first request (namely, the Shopping service’s
orderShirtsspan) is the root span of the trace. -
Several of the spans in our sample trace have parent-child relationships to other spans in the trace. For example, the Styling service’s makeShirts span has two child spans (printShirts and giftWrap), and each of these spans has a child span of its own.
-
A parent-child relationship exists between two spans when one operation passes data or control to another, either in the same service or in a different one. A parent span with multiple children represents a request that invokes multiple operations, either serially or in parallel. You can think of the trace as a tree of related spans. The trace has a unique trace ID, which is shared by each member span in the tree.
-
Trace IDs are not normally displayed because they are long and hard to remember. For convenience, we refer to a trace by using the service and operation of its root span. This means we use shopping: orderShirts as the label for the entire trace, as well as for its root span.
-
Different traces have the same label if they represent different calls to the same operation. For example, a new, separate trace begins every time the Shopping service’s orderShirts API is called. The trace in our example is just one of potentially thousands of traces that start with a call to orderShirts. Each such trace has a unique trace ID, and normally has a different start time and duration.
 |
Spans
A trace consists of one or more spans, which are the individual segments of work in the trace. Each Operations for Applications span represents time spent by an operation in a service (often a microservice).
Spans are the fundamental units of trace data. This page provides details about the format we use for a span, and the RED metrics that we automatically derive from each span. These details are useful for advanced customization.
Operations for Applications Span Format
A well-formed Operations for Applications span consists of fields and span tags that capture span attributes. We use these to identify and describe a span, organize it into a trace, and display the trace according to the service and application that emitted it. Some attributes are required by the OpenTelemetry specification and others are required by the Operations for Applications service.
Most use cases do not require you to know exactly how the Operations for Applications service expects a span to be formatted:
- When you instrument your application with OpenTelemetry your application emits spans with the required tags.
- When you instrument your application with a sender SDK, your application emits spans that are automatically constructed from raw data you pass as parameters.
- When you instrument your application with a 3rd party distributed tracing system (Jaeger or Zipkin), your application emits spans that are automatically transformed by the integration you set up.
It is possible to manually construct a well-formed span and send it either directly to the Operations for Applications service or to a TCP port that the Wavefront proxy is listening on for trace data. You might want to do this if you instrumented your application with a proprietary distributed tracing system.
The valid characters in an application and service name are: a-z, A-Z, 0-9, hyphen ("-"), underscore ("_"), dot ("."), forward slash ("/") and comma (",").
If your application or service names have any other characters other than the valid characters, the Operations for Applications service replaces each of those characters with a hyphen ("-").
|
Span Syntax
<operationName> source=<source> <spanTags> <start_milliseconds> <duration_milliseconds>
Fields must be space separated and each line must be terminated with the newline character (\n or ASCII hex 0A).
For example:
getAllUsers source=localhost traceId=7b3bf470-9456-11e8-9eb6-529269fb1459 spanId=0313bafe-9457-11e8-9eb6-529269fb1459 parent=2f64e538-9457-11e8-9eb6-529269fb1459 application=Wavefront service=auth cluster=us-west-2 shard=secondary http.method=GET 1552949776000 343
|
Span Fields
| Field | Required | Description | Format |
|---|---|---|---|
operationName |
Yes | Name of the operation represented by the span. | String of less than 1024 characters. Valid: a-z, A-Z, 0-9, hyphen ("-"), underscore ("_"), dot ("."). |
source |
Yes | Name of a host or container on which the operation executed. | String of less than 1024 characters. Valid: a-z, A-Z, 0-9, hyphen ("-"), underscore ("_"), dot ("."). |
spanTags |
Yes | See Span Tags, below. | |
start_milliseconds |
Yes | Start time of the span, expressed as Epoch time. | Whole number of Epoch milliseconds or other units (see below). |
duration_milliseconds |
Yes | Duration of the span. | Whole number of milliseconds or other units (see below). Must be greater than or equal to 0. |
|
Span Tags
Span tags are special tags associated with a span and are key-value pairs.
- Required. Many of the span tags are required for a span to be valid.
- Optional (Custom). An application can be instrumented to include custom span tags. Custom tag names must not use the reserved span tag names.
Here’s the maximum number of characters for span tags:
| Element | Maximum Length | Description |
|---|---|---|
| Span tag key | 128 | If the span tag key exceeds the maximum length, the span associated with it is blocked by the Operations for Applications service. |
| Span tag value | 128 | If the span tag value exceeds the maximum length, the value is truncated to the maximum number of characters. |
The following table lists span tags that contain information about the span’s identity and relationships.
| Span Tags for Identity | Required | Description | Type |
|---|---|---|---|
traceId |
Yes | Unique identifier of the trace that the span belongs to. All spans that belong to the same trace share a common trace ID. | UUID |
spanId |
Yes | Unique identifier of the span. | UUID |
parent |
No | Identifier of the span’s dependent parent, if it has one. | UUID |
The following table lists span tags that describe the architecture of the instrumented application that emitted the span. We use these tags to aggregate and filter trace data at different levels of granularity. These tags correspond to the application tags you set through an Operations for Applications SDK.
| Span Tags for Filtering | Required | Description | Type |
|---|---|---|---|
application |
Yes | Name of the instrumented application that emitted the span.
The valid characters are: a-z, A-Z, 0-9, hyphen ("-"), underscore ("_"), dot ("."), forward slash ("/") and comma (","). If your application or service names have special characters, Operations for Applications replaces each special character with a hyphen ("-"). |
String |
service |
Yes |
Name of the instrumented microservice that emitted the span.
The valid characters are: a-z, A-Z, 0-9, hyphen ("-"), underscore ("_"), dot ("."), forward slash ("/") and comma (","). If your application or service names have special characters, Operations for Applications replaces each special character with a hyphen ("-"). |
String |
cluster |
Yes | Name of a group of related hosts that serves as a cluster or region in which the instrumented application runs. Specify cluster=none to indicate a span that does not use this tag. |
String |
shard |
Yes | Name of a subgroup of hosts within the cluster, for example, a mirror.
Specify shard=none to indicate a span that does not use this tag. |
String |
Make sure that your application does not send spans with multiple application/service tags. Mandatory span tags must not have multiple values.
For example, a span with two span tags service=notify and service=backend is invalid.
|
Time-Value Precision in Spans
A span has two time-value fields for specifying the start time (start_milliseconds) and duration (duration_milliseconds). Express these values in milliseconds, because Operations for Applications uses milliseconds for span storage and visualization. For convenience, you can specify time values in other units, and we convert them to milliseconds.
You must use the same precision for both time values. Operations for Applications identifies the precision of the start_milliseconds value, and interprets the duration_milliseconds value using the same unit. The following table shows how to indicate the start-time precision:
| Precision for Start Time Values | Number Format | Sample Start Value | Stored As Milliseconds | Conversion Method |
|---|---|---|---|---|
| Seconds | Fewer than 13 digits | 1533529977 |
1533529977000 |
Multiplied by 1000 |
| Milliseconds (Thousandths of a second) |
13 to 15 digits | 1533529977627 |
1533529977627 |
– |
| Microseconds (Millionths of a second) |
16 to 18 digits | 1533529977627992 |
1533529977627 |
Truncated |
| Nanoseconds (Billionths of a second) |
19 or more digits | 1533529977627992726 |
1533529977627 |
Truncated |
For example, suppose you know a span started at 1533529977627 epoch milliseconds, and lasted for 3 seconds. In Operations for Applications span format, you could specify either of the following pairs of time values:
1533529977 |
3 |
(both values in seconds) |
1533529977627 |
3000 |
(both values in milliseconds) |
|
Indexed and Unindexed Span Tags
Operations for Applications uses indexes to optimize the performance of queries that filter on certain span tags. For example, we index the application tags (application, service, cluster, shard) so you can quickly query for spans that represent operations from a particular application, service, cluster, or shard. We also index certain built-in span tags, such as span.kind, component, http.method, and error.
For performance reasons, we automatically index built-in span tags with low cardinality. (A tag with low cardinality has comparatively few unique values that can be assigned to it.) So, for example, a tag like spanId is not indexed.
|
Tracing Traffic
In the Application Map, tracing traffic shows how applications and services interact with each other. If you click on a tracing traffic, you can drill down to the trace browser.
In the image shown below each arrow shows tracing traffic between application components. The arrows show direction of traffic.

To understand how to query for tracing traffic in the tracing browser, see Use Spans to Examine Applications and Services.
|
RED Metrics
Operations for Applications derives RED metrics from the spans that are sent from the instrumented application. We automatically aggregate and display RED metrics for different levels of detail with no additional configuration or instrumentation on your part.
RED metrics are key indicators of the health of your services, and you can use them to help you discover problem traces. RED metrics are measures of:
- Rate of requests – number of requests being served per minute
- Errors – number of failed requests per minute
- Duration – per-minute histogram distributions of the amount of time that each request takes
Span RED Metrics and Trace RED Metrics
Operations for Applications uses ingested spans to derive RED metrics for two kinds of request:
-
Span RED metrics measure individual operations, typically within a single service. For example, a span RED metric might measure the number of calls per minute to the
dispatchoperation in thedeliveryservice.We use span RED metrics as the basis for certain predefined charts, such as the Service Dashboard.
-
Trace RED metrics measure traces that start with a given root operation. For example, a trace RED metric might measure the number of traces that each start with a call to the
orderShirtsoperation in theshoppingservice.We derive trace RED metrics from each trace’s root span and end span. If a trace has multiple root spans, the earliest is used. You need to query for trace metrics to visualize them.
|
RED Metric Counters and Histograms
In the predefined charts, such as the Service Dashboard, are rates and 95th percentile distributions. These metrics are themselves based on underlying delta counters and histograms that Operations for Applications automatically derives from spans. You can use these underlying delta counters and histograms in RED metrics queries, for example, to create alerts on trace data.
Operations for Applications constructs the names of the underlying delta counters and histograms as shown in the table below. The name components <application>, <service>, and <operationName> are string values that are obtained from the spans on which the metrics are derived. If necessary, Operations for Applications modifies these strings to comply with the Operations for Applications data format for metrics. Each metric is associated with point tags application, service, and operationName, and the corresponding span tag values are assigned to these point tags. The span tag values are used without modification.
| Span RED Metric Names | Metric Type | Description |
|---|---|---|
tracing.derived.<application>.<service>.<operationName>.invocation.count |
Delta counter | The number of times that the specified operation is invoked. You can query delta counters using cs() queries. Used in the Request Rate chart that is generated for a service. |
tracing.derived.<application>.<service>.<operationName>.error.count |
Delta counter | The number of invoked operations that have errors (i.e., spans with error=true). You can query delta counters using cs() queries.Used in the Error Rate chart that is generated for a service. |
tracing.derived.<application>.<service>.<operationName>.duration.micros.m |
Operations for Applications histogram | The duration of each invoked operation, in microseconds, aggregated in one-minute intervals. Used in the Duration chart that is generated for a service. |
| Trace RED Metric Names | Metric Type | Description |
|---|---|---|
tracing.root.derived.<application>.<service>.<operationName>.invocation.count |
Delta counter | The number of traces that start with the specified root operation. You can query delta counters using cs() queries. |
tracing.root.derived.<application>.<service>.<operationName>.error.count |
Delta counter | The number of traces that start with the root operation, and contain one or more spans with errors
(i.e., spans with error=true). You can query delta counters using cs() queries. |
tracing.root.derived.<application>.<service>.<operationName>.duration.millis.m |
Operations for Applications histogram | The duration of each trace, in milliseconds, aggregated in one-minute intervals. Duration is measured from the start of the earliest root span to the end of the last span in a trace. |
|
RED Metrics Queries
You can perform queries over RED metric counters and histograms and visualize the results in your own charts, just as you would do for any other metrics. You can use RED metrics in query conditions when you create alerts on trace data.
Examples
Find at the per-minute error rate for a specific operation executing on a specific cluster:
cs(tracing.derived.beachshirts.shopping.orderShirts.error.count and cluster=us-east-1)
Find the per-minute error rate for traces that begin with a specific operation:
cs(tracing.root.derived.beachshirts.shopping.orderShirts.error.count)
Use a histogram query to return durations at the 75th percentile for an operation in a service. (The predefined charts display only the 95th percentile.)
percentile(75, hs(tracing.derived.beachshirts.delivery.dispatch.duration.micros.m))
Syntax Alternatives
You can specify the RED metric counters and histograms in a query with the metric name or with point tags:
- Use the metric name, for example:
cs(tracing.derived.beachshirts.delivery.dispatch.error.count) - Use the point tags
application,service, andoperationNamethat Operations for Applications automatically associates with the metric, for example:cs(tracing.derived.*.invocation.count, application="beachshirts" and service="delivery" and operationName="dispatch")
The point tag technique is useful when the metric name contains string values for <application>, <service>, and <operationName> that have been modified to comply with the Operations for Applications data format. The point tag value always corresponds exactly to the span tag values.
|
Aggregated RED Metrics
Pre-aggregated RED metrics speed up RED metric queries. service level RED metrics by aggregating the RED metrics derived from spans. Querying and aggregating these metrics can be slow due to high cardinality from operation tags, source tags, and custom tags.
Operations for Applications constructs the names of the underlying aggregated delta counters, and histograms as shown in the table below. The <application> and <service> in the name are string values that are obtained from the spans from which the metrics are derived. You can filter the aggregated RED metrics using the application, service, cluster, shard, source, and span.kind point tags. The screenshot below filters by application. Operations for Applications assigns the corresponding span tag values to these point tags.

| Aggregated RED Metric Names | Metric Type | Description |
|---|---|---|
tracing.aggregated.derived.<application>.<service>.invocation.count |
Delta counter | Number of spans for the specified application and service. |
tracing.aggregated.derived.<application>.<service>.error.count |
Delta counter | Number of spans that have errors for the specified application and service.
(i.e., spans with error=true). |
tracing.aggregated.derived.<application>.<service>.duration.millis.m |
Operations for Applications histogram | Duration of each spans, in microseconds, aggregated in one-minute intervals. Duration is measured from the start of the earliest root span to the end of the last span in a trace. |
Example Queries
- Request rate or invocation count for an edge: Find the per-minute request rate for a specific application.
cs(tracing.aggregated.derived.beachshirts.*.invocation.count) - Error percentage for an edge: Find the per-minute aggregated error rate for traces for a specific
span.kindtag.cs(tracing.aggregated.derived.beachshirts.shopping.error.count, span.kind=server) - Duration as histogram: Find the 95th percentile of a specific service using aggregated RED metrics.
alignedSummary(95, merge(hs(tracing.aggregated.derived.beachshirts.delivery.duration.micros.m)))
|
RED Metrics for Tracing Traffic
You can visualize tracing traffic data in charts using tracing traffic derived metrics and filter those data using the point tags listed below. The corresponding span tag values are assigned to these point tags. The span tag values are used without modification.

| Point Tags | Description |
|---|---|
application
|
Name of the application the request is sent from. |
service
|
Name of the microservice that request is sent from. |
cluster
|
Name of a group of related hosts that serves as a cluster or region in which the application that sent the request runs. |
shard
|
Name of a subgroup of hosts within the cluster that sent the request, for example, a mirror. |
source
|
Name of a host or container on which the applications or services sent requests. |
to.application
|
Name of the application the request is sent to. |
to.service
|
Name of the service the request is sent to. |
to.cluster
|
Name of a group of related hosts that serves as a cluster or region in which the application that received the request runs. |
to.shard
|
Name of a subgroup of hosts within the cluster that received the request, for example, a mirror. |
to.source
|
Name of a host or container on which the applications or services received requests. |
| Tracing Traffic Derived Metric Name | Metric Type | Description |
|---|---|---|
tracing.edge.derived.<application>.<service>.invocation.count |
Delta counter | Number of tracing traffic that start from an application and service. |
tracing.edge.derived.<application>.<service>.error.count |
Delta counter | Number of tracing traffic that starts from an application and service, that are errors. |
tracing.edge.derived.<application>.<service>.duration.millis.m |
Operations for Applications histogram | Duration of the request in milliseconds, aggregated in one-minute intervals. |
Example Queries
- Request rate or invocation count for a tracing traffic.
cs(tracing.edge.derived.beachshirts.*.invocation.count, to.shard=primary) - Error percentage for a tracing traffic.
cs(tracing.edge.derived.beachshirts.shopping.error.count, cluster=us-west) - Duration in the form of Operations for Applications histograms.
hs(tracing.edge.derived.beachshirts.shopping.duration.millis.m, to.service=delivery)
|
Tracing Critical Path Data
The Tracing Browser shows you all the spans that make up a trace and the critical path. The trace details panel uses an orange line to show the critical path through a trace. You can view the critical path data as metrics and query them using the hs() function. See View Tracing Critical Path Data in Charts for details.
|
Trace Sampling and Derived RED Metrics
If you have instrumented your application with an Operations for Applications SDK, Operations for Applications derives the RED metrics from 100% of the generated spans, before any sampling is performed. This is true when the sampling is performed by the SDK or when the sampling is performed by a Wavefront proxy. Consequently, the RED metrics provide a highly accurate picture of your application’s behavior. However, if you click through a chart to inspect a particular trace, you might discover that the trace has not actually been ingested. You can consider configuring a less restrictive sampling strategy.
If you have instrumented your application using a 3rd party distributed tracing system, Operations for Applications derives the RED metrics after sampling has occurred. The Wavefront proxy receives only a subset of the generated spans, and the derived RED metrics will reflect just that subset. See Trace Sampling and RED Metrics from an Integration.
|
External Services
On the application map, external applications or services are highlighted with special icons. For example, in the screenshot below, the application communicates with AWS Lambda, Amazon Simple Notification Service (SNS), and external databases. For details, see Configure External Services.

|
Apdex
The Application Performance Index (Apdex) helps you understand how the response time of a service compares to the predefined response time threshold. Operations for Applications detects ingested application trace data as first-class citizens and calculates the Apdex score using the threshold value (T) you define. The default threshold value (T) is set to 100ms, and only Super Admin users and users with the Applications permission can configure the threshold value.
|
Application Tags
An ApplicationTags object describes your application to the Operations for Applications service. The service requires tags that describe the structure of your application. These application tags are associated with the metrics and trace data that are sent by the instrumented microservices in your application.
You specify a separate ApplicationTags object, with a separate set of tag values, for each microservice you instrument. The tags include information about the way your application is structured and deployed, so your code normally obtains tag values from a configuration file at runtime. The configuration file might be provided by the Operations for Applications SDK, or it might be part of a custom configuration mechanism that is implemented by your application. (Only SDKs with quickstart setup steps provide a configuration file.)
ApplicationTags object to store any additional custom tags that you want to associate with reported metrics or trace data.How the Operations for Applications Uses Application Tags
Operations for Applications uses application tags to aggregate and filter data at different levels of granularity.
- Required tags enable you to drill down into the data for a particular service:
application- Name that identifies the application, for example,beachshirts. All microservices in the same application should use the sameapplicationname.service- Name that identifies the microservice, for example,shopping. Each microservice should have its ownservicename.
- Optional tags enable you to use the physical topology of your application to further filter your data:
cluster- Name of a group of related hosts that serves as a cluster or region in which the application will run, for example,us-west.shard- Name of a mirror or other subgroup of hosts within a cluster, for example,primary.
|
Span Logs
OpenTelemetry span events capture span-specific logging messages and other debugging or informational output from the application itself. Operations for Applications converts these span events to span logs.
Span logs are especially useful for recording additional information about errors within the span.
You can instrument your application to emit one or more logs with a span, and examine the logs from the Tracing UI.
|
Helper Objects That Collect and Transfer Data
The SDK you’re using determines which helper objects are in a microservice.
A typical set of helper objects includes some or all of the following:
Wavefront Sender Object
When you instrument an application, you set up a mechanism for sending metrics and trace data to the Operations for Applications service. Choose between:
- Sending data directly to the Operations for Applications service, also called direct ingestion.
- Sending data to a Wavefront proxy, which then forwards the data to the Operations for Applications service.
Your choice is represented in your code as a Wavefront sender object.
(Most Operations for Applications SDKs define objects of type WavefrontSender or simply Sender. A few SDKs define a pair of separate Client objects.) A Wavefront sender encapsulates the settings you supply when you instrument your microservice. The settings in your code must match the Wavefront proxy ports and configurations you define when sending data.
|
WavefrontTracer and WavefrontSpanReporter
The following objects create and report trace data:
WavefrontTracercreates spans and traces.WavefrontSpanReporterforwards the trace data to the Wavefront sender.
A WavefrontSpanReporter specifies the source of the reported trace data – by default, the host that the code is running on. You can optionally specify a more useful source name explicitly during setup, for example, an IP address, a container or instance name, or some other unique data source. All reporter objects for a particular microservice must specify the same source.
Trace data is reported automatically whenever spans are complete, so a WavefrontSpanReporter does not specify a reporting interval.
CompositeReporter to combine a WavefrontSpanReporter with a ConsoleReporter. A ConsoleReporter sends trace data to your console. |
Metrics Reporter Objects
You can use one or more reporter objects to gather metrics and histograms and forward that data to the Wavefront sender. Different Operations for Applications reporter objects gather data from different components of your application. For example, a WavefrontJvmReporter reports runtime data from the JVM.
An Operations for Applications reporter object specifies:
-
The reporting interval for metrics and histograms. The reporting interval controls how often data is reported to the Wavefront sender and therefore determines the timestamps of data points sent to Operations for Applications. The default reporting interval is once a minute.
-
The source of the reported metrics and histograms – by default, the host that the code is running on. You can optionally specify a more useful source name explicitly during setup, for example, an IP address, a container or instance name, or some other unique data source. All reporter objects for a particular microservice must specify the same source.
|