The Application Performance Index (Apdex) is an industry standard that can help you understand how the response time of a service compares to a predefined response time threshold.
Overview
You can measure the performance of a service using Request, Error, and Duration (RED) metrics for a given time frame. But it is hard to compare these values and understand how each service performs. Apdex helps you compare the response time of a service based on the response time threshold that you define.
When you send your applications trace data to VMware Aria Operations for Applications (formerly known as Tanzu Observability by Wavefront), the application data is detected as first-class citizens using the traces, and the Apdex score is calculated using the threshold value (T) you define. Use apdex() to query the Apdex score of a service, view the results in charts, and create alerts.
The default threshold value (T) is set to 100ms, and only Super Admin users and users with the Applications permission can configure the threshold (T).
Apdex Score
The Apdex score is calculated using the following equation:
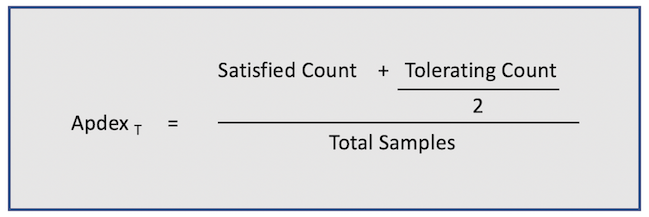
The table below defines the terms used in the equation.
| Term | Description |
|---|---|
| ApdexT | The Apdex score is calculated based on the response time threshold (T). Only a Super Admin user or users with the Applications permission can change this value. See Configure the Threshold (T) Value. |
| Satisfied count | Number of requests that received a response in T or less. |
| Tolerating count | Number of requests that are 4 times T (4T) or less. |
| Frustrated count | Number of requests that take more than 4 times T (4T) to complete. These requests are not used to calculate the Apdex score. |
| Total samples | Total number of requests used to calculate your Apdex score. |
Interpreting the Apdex Score
The Apdex score is a value between 0 to 1.
- If the score is 0, none of the requests of the service satisfied the response time threshold (T) you defined.
- If the score is 1, all the requests of the service satisfy T.
We use the following Apdex score range to help you understand how your service is performing:
| Range | Service Performance | Color |
|---|---|---|
| 0.94 - 1 | Excellent |

|
| 0.85 - 0.93 | Good |

|
| 0.70 - 0.84 | Fair |

|
| 0.50 - 0.69 | Poor |

|
| 0.49 - 0 | Unacceptable |

|
Example
Let’s take a look at an example to get familiar with how the Apdex score is calculated.
The shopping service in the beachshirts application handles 300 requests during a 3 minute period, and T is set to 500ms.
- 230 requests were handled within 500ms. This is the satisfied count.
- 40 requests were handled between 500ms and 2 seconds (2000ms). This is the tolerating count.
-
The remaining 30 requests ended up as errors or took longer than 4T (2 seconds) to complete. This is the frustrated count, and it is not used to calculate the Apdex score.
ApdexT = ( 230 + (40/2)) / 300 = 0.83
Based on the Apdex score, you now know that the performance of the shopping service is good.
Configure the Threshold (T) Value
A Super Admin user or users with the Applications permission can change the response time threshold (T), which defaults to 100ms using one of the following options:
- Using the Application Configuration page.
- Using the legend on the application status page that has the application map, table view, or grid view.
Update the Threshold from the Application Configuration Page
From the Application Configuration page, you can update the threshold value of multiple services at once. Follow these steps:
- Click Applications > Application Configuration. You see a list of the applications that send trace data to the Operations for Applications service.
- Click the application that has the services you want to configure. Now, you see a list of all the services in the application.
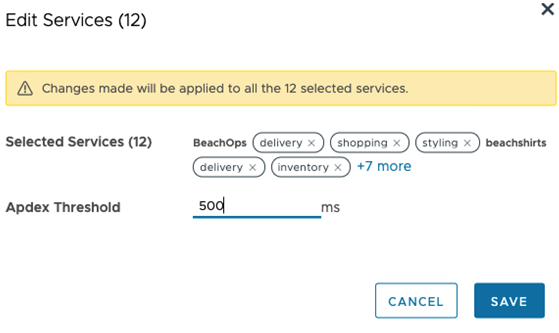
- Select the check boxes next to the services that you want to edit and click the Edit Settings button on the top of the list.
Note: Only a Super Admin user or users with the Applications permission can configure the Apdex threshold. If you are not a Super Admin user, you see the following message: You don’t have permission to update this page.
- Update the Apdex Threshold value and click Save.
Update the Threshold from the Legend on the Application Status Page
You can update the response time threshold (T) using the Settings icon on the app map, table view, or grid view on the Application Status page.
- Click Applications > Application Status.
- Click the settings icon on the app map, table view, or grid view.
- From the drop-down menu under Legend Settings, select Apdex.
- Click Configure Apdex.
Note: Only a Super Admin user or users with the Applications permission can configure the threshold (T). If you are not a Super Admin user, you don’t see Configure Apdex.
Now, you see a list of all the services that send trace data to the Operations for Applications service. You can sort the table by the service name, application name, service status (active or inactive), and the threshold (T) value. - Select the check boxes next to the services that you want to edit and click the Edit Settings button on the top of the list.
- Update the Apdex Threshold value and click Save.
See Also
- Learn how to use the apdex() function, to see Apdex score data on charts, and create alerts.
- Use apdexLatency() to query the satisfied threshold (T) and toleration threshold (4T) of a service.