VMware Aria Operations for Applications (formerly known as Tanzu Observability by Wavefront) includes dashboard variables and global filters. Both are excellent ways of focusing the metrics that a dashboard displays.
- All users can set predefined variables for a dashboard. The change applies to all charts in that dashboard.
- All users can specify global filters - key-value pairs for filtering dashboard results.
- All users can include dashboard variables in queries. The query uses the current value of the variable.
Dashboard Variable Use Cases
Dashboard variables make it easy for all users to refocus what a dashboard displays. For example:
- An environment includes a tag
envthat can beprodordev. You can use a list variable to allow users to pick one - and you can define a label that makes it easy for users to make the choice. - An environment that has a growing fleet of machines. You can use a dynamic variable that accesses the
sourceto allow users to choose from currently available sources.
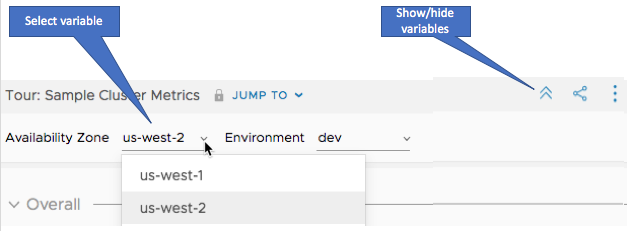
Change and Show/Hide Variables (View Mode)
All users can show or hide the variables bar and can select from the predefined variables once the bar is visible. If no variables are defined for the dashboard, the show/hide icon is not visible.
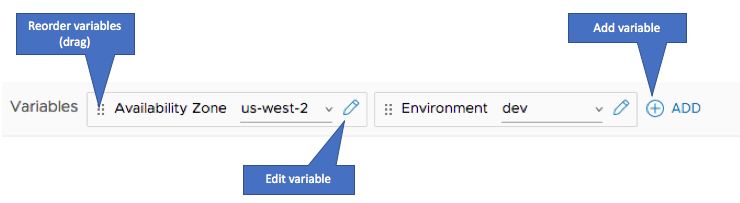
Create, Modify, and Save Variables (Edit Mode)
Users with the Dashboard permission can create variables, use them in queries, and save the dashboard. After the dashboard has been saved, the variable shows up in the dashboard bar and all users can make selections.
Dashboard Variable Scope
Different types of dashboard variables can help in different ways:
- Simple: Maps a single variable to a single value. Use a simple dashboard variable if you want to update all charts on the dashboard to query for a different item, for example, for a different source.
-
List: Use a list variable to present choices. The following example shows a list variable that allows users to make all charts in a dashboard use a contract duration of 1 year or 3 years.

- Dynamic: Use a dynamic variable to show choices that interactively change your dashboard based on the source, metric, point tag, and other options.
Dashboard variables can contain:
- Metric names
- Filters
- Advanced functions
- A string such as “)))”, which could be inserted at the end of a query.
Create a Dashboard Variable
To create a dashboard variable:
- In the top right corner, select Edit from the ellipsis icon to put your dashboard into edit mode.
-
Click the Add icon in the variables bar.
- In the Add Variable dialog box:
- Specify the Variable Name – Name you can use in queries that use the variable. Keep this name short.
- Select the Variable Type.
- Specify the Display Name.
- To make your dashboard variable invisible when the dashboard is not in edit mode, click Hide when not in edit mode. The dashboard variable can still be used in ts() expressions and is visible in edit mode.
- Fill in remaining fields depending on the variable type (discussed below):
Edit a Dashboard Variable
Editing a dashboard variable is similar to creating a dashboard variable.
- In the top right corner, select Edit from the ellipsis icon to put your dashboard into edit mode.
-
Click the Edit icon in the variables bar and select Edit.
- In the Add Variable dialog box:
- Specify the Variable Name – Name you can use in queries that use the variable. Keep this name short.
- Select the Variable Type.
- Specify the Display Name.
- To make your dashboard variable invisible when the dashboard is not in edit mode, click Hide when not in edit mode. The dashboard variable can still be used in ts() expressions and is visible in edit mode.
- Fill in remaining fields depending on the variable type (discussed below):
Clone or Delete a Dashboard Variable
To clone or delete a dashboard variable:
- In the top right corner, select Edit from the ellipsis icon to put your dashboard into edit mode.
- Select Clone or Delete from the pencil icon drop-down menu.
Use Dashboard Variables in Queries
You reference a variable in a ts() expression using the syntax ${variableName}.
Here’s an example that uses a simple variable:
- Define a variable
azand give it the valuetag="az-3" or source="app-3". -
Using Query Editor, use the variable in a query like this:
ts(cpu.loadavg.1m, ${az}). -
When the query engine executes this query, it replaces
${az}with the current variable value and executes this query:ts(cpu.loadavg.1m, tag="az-3" or source="app-3").
Create a Simple Dashboard Variables
A simple dashboard variable maps a single variable to a single value. Simple variables are useful, for example, if you want to use a complex filter in multiple queries and you don’t want to repeat the complex filter each time. The example above illustrates this.
Create a Simple Dashboard Variable
- In the top right corner, select Edit from the ellipsis icon to put your dashboard into edit mode.
- Click the Add icon in the variables bar.
- Enter a variable name (case sensitive). Keep the name short - this is what you’ll use in queries.
- Select Simple from the drop-down menu.
- (Optional) Enter an initial value for the variable.
- (Optional) Change the display name if you want to show something different in the Variables bar.
- Click Accept to save the dashboard variable, the Save again to save the dashboard.
Use a Simple Dashboard Variable
- Give the variable a value from the Variables section of the dashboard in one of these ways:
- To make a permanent change, edit the dashboard.
- To make a temporary change, specify the value in the dashboard’s Variables section.
- In your query or queries, use the variable as ${myvar} where you’d like to use the string of text.
List Dashboard Variables
A list dashboard variable allows users to pick a value from a list.
Create a List Dashboard Variable
- In the top right corner, select Edit from the ellipsis icon to put your dashboard into edit mode.
- Click the Add icon in the variables bar.
- Enter a variable name (case sensitive). Keep the name short - this is what you’ll use in queries.
- Select Variable Type > List. Each row lets you specify a display name and variable value. When the user selects the item from the menu, we use the specified value in all queries that use the variable.
- Add, remove, or clone fields by using the icons on the right.
- (Optional) Set the default.
- Click Accept and click Save to save your dashboard.
Supported Characters
List values can contain alphanumerical characters (a-z, A-Z, 0-9), underscore (_), greater than (>), less than (<), parenthesis (()), minus (-), period (.), and space.
Use a List Dashboard Variable
All users can set the value of the list variable:
- Find the variable in the variables bar at the top of the dashboard.
-
Select the variable value from the drop-down menu.

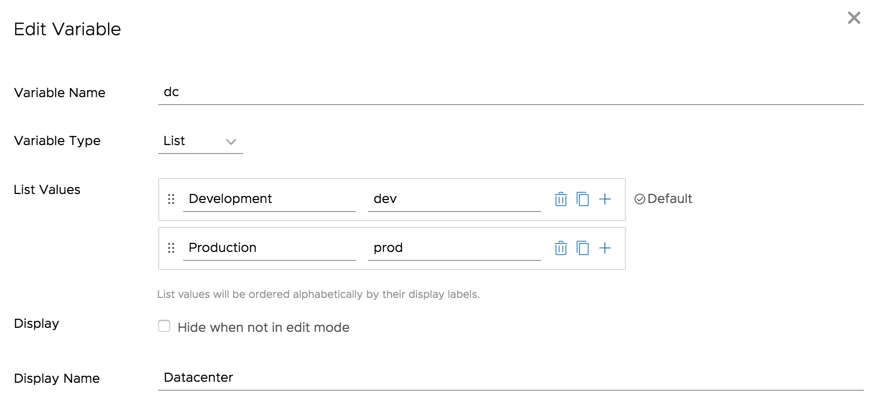
List Dashboard Variable Example
- Suppose that sources located in Availability Zone 1 are production and Availability Zone 2 are development.
- You can define a list variable with:
- Name: env
- Options:

- Label Datacenter
- Users who edit charts can use the variable in queries as
${env}. - All users can select Production or Development from the Datacenter menu in the variables bar to set the value of
${env}toprodordev.
Dynamic Dashboard Variables
The values of a dynamic dashboard variable are dynamically determined by a query. You use a dynamic variable if you can’t predict ahead of time what the available choices are. For example, if you know that the datacenter is development or production, you can use a list variable. But if you want to allow users to select from a list of hosts, and the actual hosts change, you use a dynamic variable.
*) for each option. That means users can limit the display or show results for all values of the variable.Dynamic Dashboard Variable Field Options
Dynamic dashboard variables allow you to select one of the following options.
- Source - Populates the dynamic variable list with sources associated with the query in the Query field.
- Source Tag - Populates the dynamic variable list with source tags that match
tag=part of your ts() expression. For examplets(cpu.load, tag="app*")populates the dynamic variable list with"app-tag1","app-tag2"and so on. - Matching Source Tag - This will get all of the sources from your ts() expression, then, find all the source tags associated with those sources and populate the dynamic variable list with those source tags. If the query returns at least 1 source associated with a source tag, Matching Source Tag will display source tags.
- Metric - Populates the dynamic variable list with metrics associated with the query in the Query field.
- Point Tag - Populates the dynamic variable list with point tag values (of the point tag key in Point Tag Key field) associated with the query in the Query field.
The example below uses the Metric field to populate a dynamic variable list.
If you define a dynamic dashboard variable named var2 that refers to a source, source tag, or point tag, you use ${var2} in a query like this:
- Source -
ts(<metricName>, source="${var2}") - Source Tag -
ts(<metricName>, tag="${var2}") - Point Tag -
ts(<metricName>, \<pointTagKey\>="${var2}"). Here,pointTagKeymust match the key you set up when you created the dynamic dashboard variable.
Create a Dynamic Dashboard Variable
This example uses a point tag dynamic variable. You can select a value or select the wildcard character to mean all possible values.
- In the top right corner, select Edit from the ellipsis icon to put your dashboard into edit mode.
- Click the Add icon in the variables bar.
- Select the Variable Type Dynamic.
- From the Field drop-down menu, select one of the options, for example, Point Tag.
- Type a query that has results.
- Select a default value and click Accept.
- Click Save in the top right to save your dashboard and the dashboard variable.

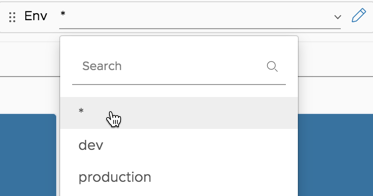
Use the Dynamic Variable
- Find the variable in the variables bar at the top of the dashboard.
- Select the variable value from the drop-down menu.
In this example, we can filter the dashboard to set the point tag env to prod, to dev, or to allow both values.
Dynamic Variable Example
The following example uses the ~sample data included in your product instance.
First, we create the dynamic variable:
- Specify a variable name and type Dynamic.
- Select the field Source
- Specify a query that you could filter by source, in this example,
ts(~sample.cpu.loadavg.1m)As soon as we’ve specified the query, the Current Values list is populated. This list is updated dynamically. - (Optional) Change the default and hide the variable when the dashboard is not in Edit mode.
- Specify a display name and click Accept, then click Save to save the dashboard.
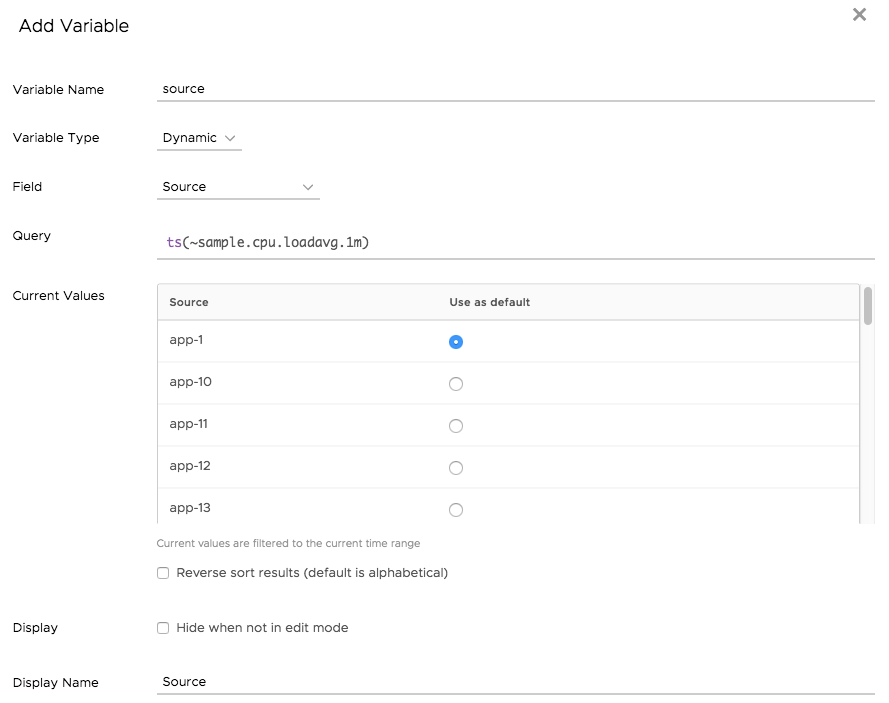 A Current Values field displays every metric name that matches the query. As with list variables, you can select a specific value as the default.
- Select a default value and click Accept.
- Click Save to save your dashboard and the dashboard variable.
After we’ve saved the dynamic dashboard variable, we can use the variable in queries. :
- Create a chart with the following query:
ts(~sample.cpu.loadavg.1m, source="${source}") - When users change the value of the Source variable in the dashboard, the query uses the selected value.
Users can select the variable value from the menu - here, users can select one of many sources. As additional sources become available or are removed, the menu items change.
