After your application starts sending trace data to VMware Aria Operations for Applications (formerly known as Tanzu Observability by Wavefront), you can examine that data in the Traces Browser. By fine-tuning the trace query in the Traces Browser, you find the traces that you’re interested in by describing the spans they must contain.
View Tracing Critical Path Data in Charts
The Traces Browser shows you all the spans that make up a trace. By examining the critical path, you can find operations that took a long time, decide which operations to optimize, and then examine optimization results. See Traces Browser for details.
You can use the hs() function to query and view critical path data as histogram metrics.
View Critical Path Data in Charts
Charts help you view the data trends and grasp data faster.
-
Use critical path raw metrics or the critical path aggregated metrics, which are metrics aggregated beforehand to reduce the compute time when running queries.
Metrics Type Description Granular metrics Get specific metrics data for a critical path. Filter the query using the application,cluster,shard,service,operationName,error, andsourcepoint tags.
Example:tracing.critical_path.derived.*.total_time.millis.mAggregated metrics Get high-level metrics for a critical path of a specific application or service. Filter queries using the application,cluster,shard, andservicepoint tags.
Example:tracing.critical_path.aggregated.derived.*.time_percent.m -
Get the time spent on the critical path as an absolute value or as a percentage.
Time Spent Description Absolute time Get the total time spent on a critical path using .total_time.millis.m.Relative time Get the total time spent on a critical path as a percentage when compared to the end to end trace duration using .time_percent.m.
Let’s look at a scenario where all the traces have the same critical path duration, but the time spent by the operations vary on the critical path. Now, you can visualize this data as a percentage usingtime_percent.mand compare how an operation/s performed on each trace.
Examples:
The screenshot below shows you the critical path for the beachshirts application’s shopping service.
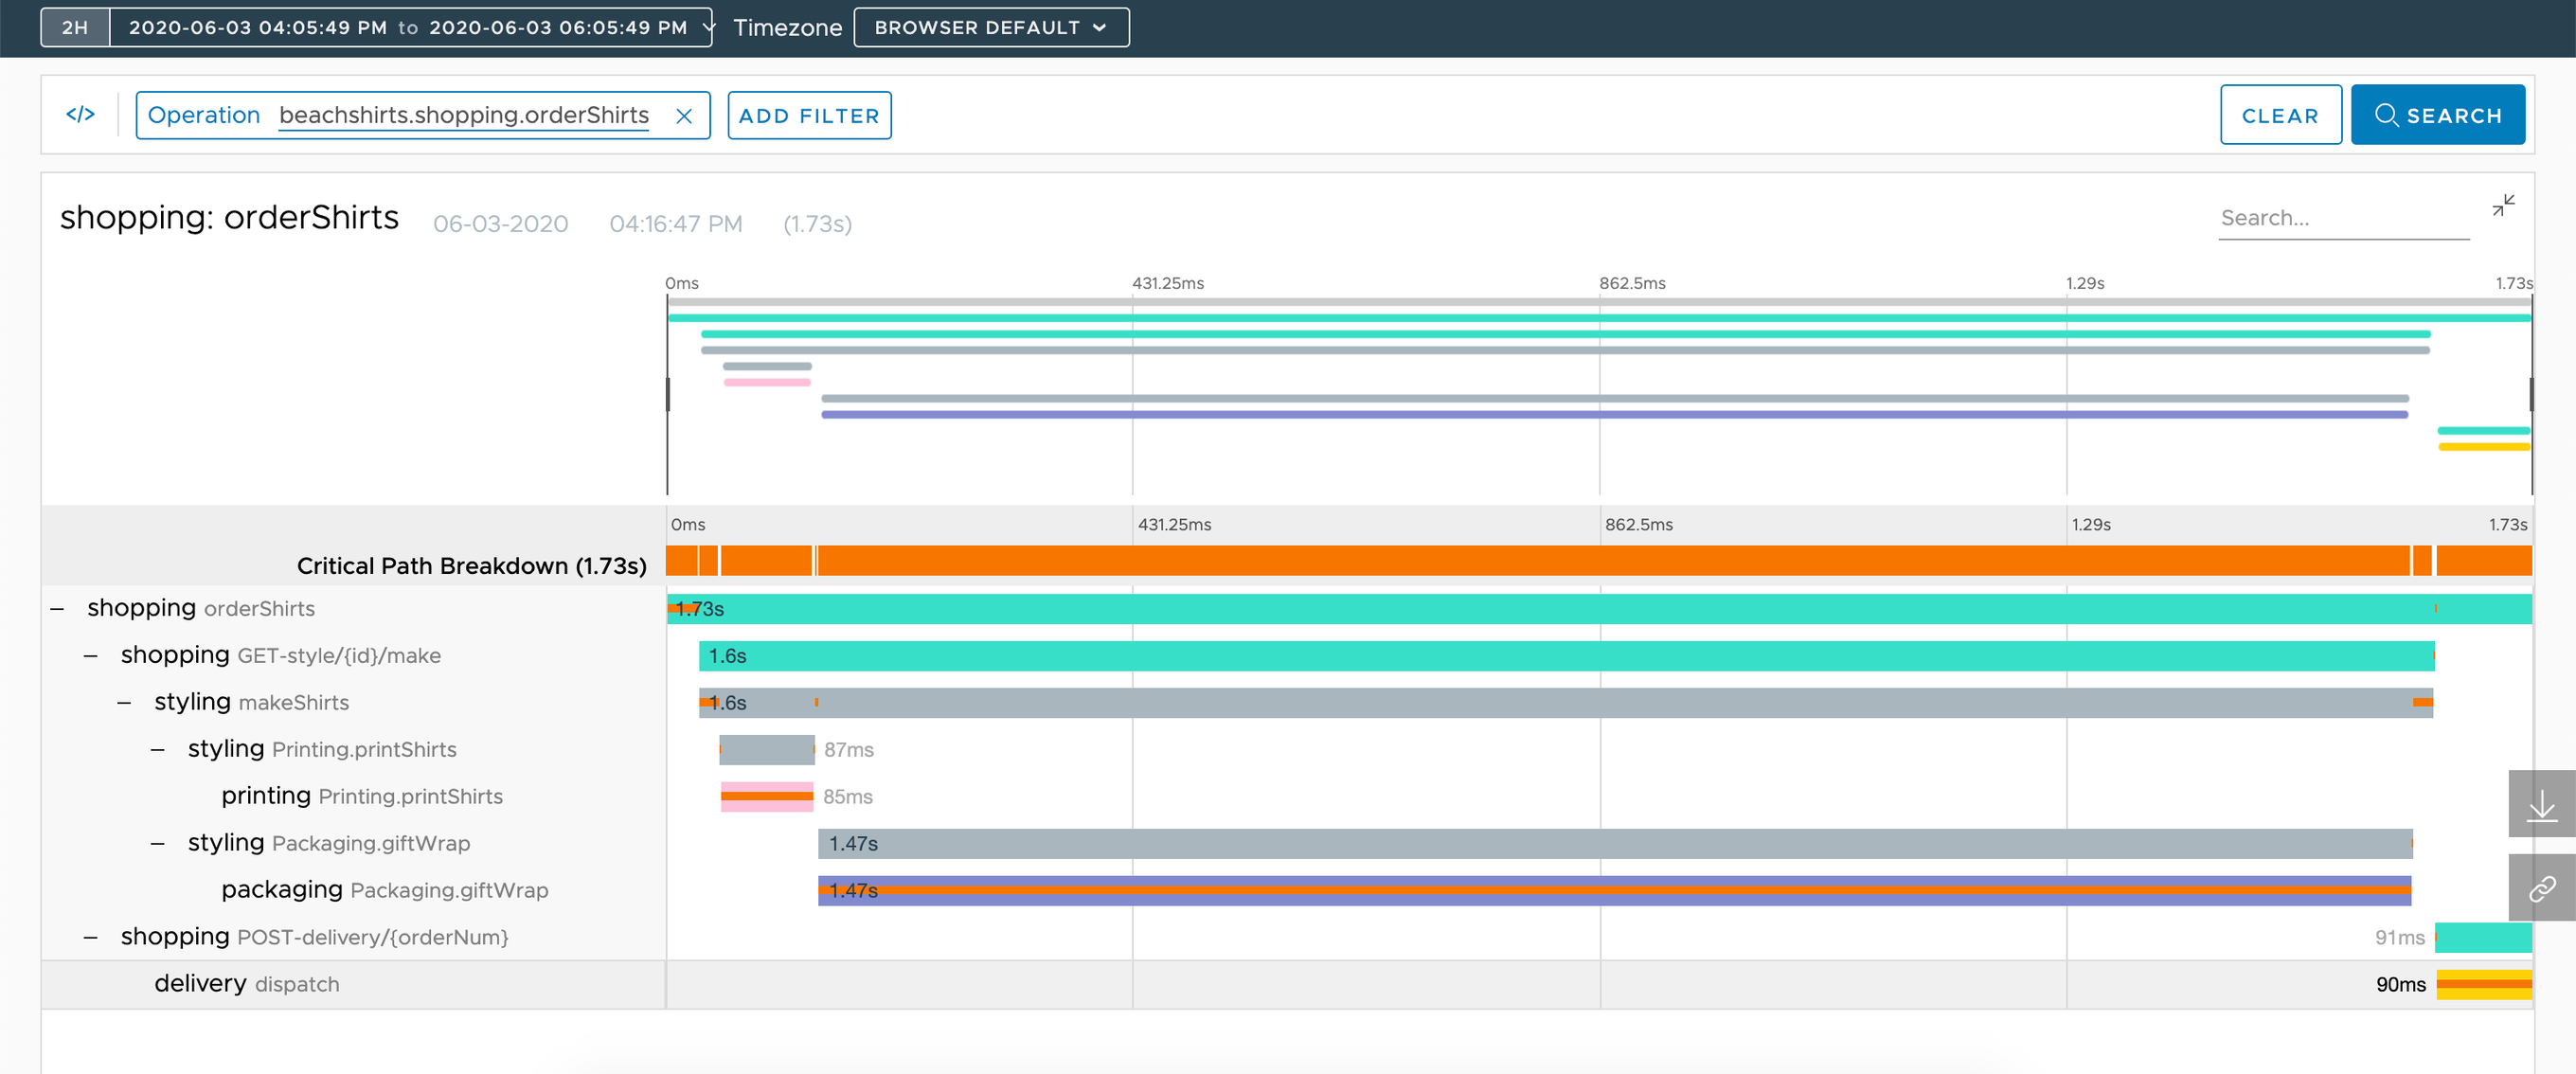
-
Granular metrics: Using granular metrics, let’s filter the query to get critical path data for the
ordershirtsoperation.- Absolute time: Let’s assume the
ordershirtsoperation spends 0.1 seconds or 100 milliseconds on the critical path.hs(tracing.critical_path.derived.beachshirts.shopping.total_time.millis.m, operationName=ShoppingWebResource.orderShirts) - Relative time: When compared to the total trace duration, which is 1.73 seconds, the
ordershirtsoperation spends 5.8% of the time on the critical path.hs(tracing.critical_path.derived.beachshirts.shopping.time_percent.m, operationName=ShoppingWebResource.orderShirts)
- Absolute time: Let’s assume the
-
Aggregated metrics: Using aggregated metrics, let’s find out the time taken by the shopping service on the critical path. Aggregated metrics give you the total time taken by each service on the critical path.
Let’s assume that the operations of the shopping service spend time as follows:ordershirts- 0.1 seconds,GET-style/{id}/make- 0.02 seconds, andPOST-delivery/{orderNum}- 0.03 seconds.- Absolute time: The shopping service spends 0.15 (0.1 + 0.02 + 0.03) seconds on the critical path.
hs(tracing.critical_path.aggregated.derived.beachshirts.shopping.total_time.millis.m) - Relative time: When compared to the total trace duration, which is 1.73 seconds, the shopping service spends 8.7% of the time on the critical path.
hs(tracing.critical_path.aggregated.derived.beachshirts.shopping.time_percent.m)
- Absolute time: The shopping service spends 0.15 (0.1 + 0.02 + 0.03) seconds on the critical path.
Create Alerts for Critical Path Data
You can query the data of a critical path, view this data in charts, and create alerts.
Example: Create an alert to get notifications when the median value of the critical path exceeds 60. You need to query the data and create the alert. See Creating Alerts for details.

Search and Filter Traces on the Traces Browser
To query traces, select Applications > Traces and navigate to the Traces Browser.
Query traces using a trace ID:
- Click Trace ID and enter the ID of the trace or traces you want to query.
 Note: Your trace ID needs to be in the UUID format (example:
00000000-0000-0000-1111-111111111111). If you copy-paste a trace ID that is not in the UUID format, we transform it for you. - Click Search in the query bar.
- If you search for a trace after 7 days because Operations for Applications retains trace data only for 7 days.
- If you search for a trace after 1 hour because you have enabled intelligent sampling for traces.
- If you use invalid query syntax.
Query traces using an operation:
- Click Operation and select an operation.
- Optionally, add one or more filters to refine your query.

- Click Search in the query bar.
Select an Operation
You select an operation to display traces with at least one span that represents the work done by that operation.
|
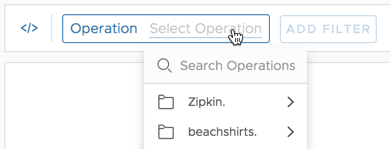
1. Select Applications > Traces to open the Traces Browser.
2. Click the Operation selector to open the cascading menu. |
 |
|
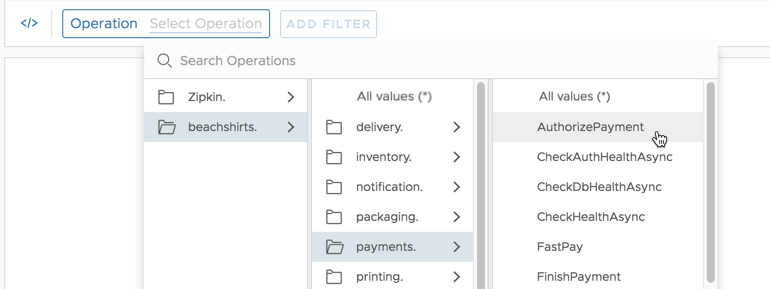
3. Use the drill-down to select the application, service, and operation.
4. Either add filters (see below) or click Search to display results. |
 |
Add Filters
After you have selected an operation, you can optionally add filters to further describe the traces you want to see. You can add different types of filters in any order.
- Select an operation.
- Click Add Filter and select a filter type.
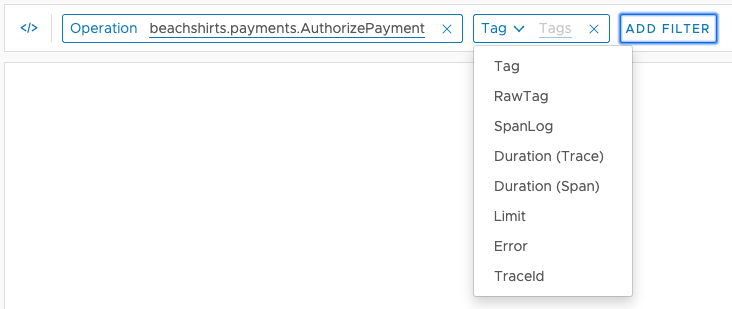
Choose This Filter Type To Return Tag Traces that have at least one span with a selected tag or a selected source (host). Use this type for indexed tags that your application uses, typically cluster,shard,component,source, and so on.UnindexedTag Traces that have customized span tags. For details, see Indexed and Unindexed Span Tags. Source Traces that are sent by the a specfic host or container on which the applications or services run. SpanLog Traces that have span logs. Duration (Trace) Traces that have a specified minimum and/or maximum length (in milliseconds). Duration (Span) Traces that have a specified minimum and/or maximum span length (in milliseconds). Limit Up to a specified number of traces. Error Traces with at least one span that contains an error ( error=true).TraceId The trace or traces that match the trace ID or trace IDs. Note: If you select TraceId you can only search by the trace ID. You cannot filter an operation by a trace ID. - Click next to the filter type and specify the filter setting. See the example given below.
- Click Add Filter to add another filter or click Search to display results.
Remove Filters
You can remove an individual filter:
|
 |
|
If you want to start the query all over, click Clear to remove the operation name and all filters: |
 |
Example
Suppose you want to find traces that contain spans for an operation called notify, which is called from the notification service of the beachshirts application. You’re interested only in seeing traces that are emitted from a particular source and that are longer than 30 milliseconds.
- Select the operation from the cascading Operation menu.
- Click Add Filter and select Tag.
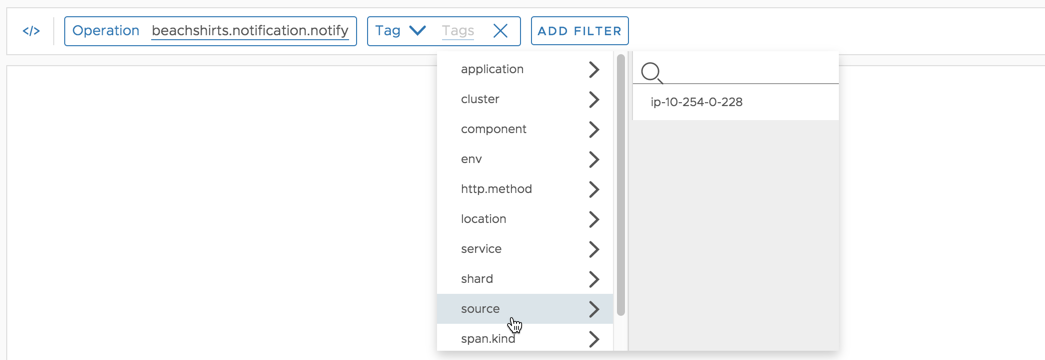
- Click the Tags selector to open a cascading menu of tag types.
- Select the source tag type to display a menu of source names, and select the source name you want.
- Click Add Filter and select Duration.
- Click the min/max Duration selector to display fields for specifying durations.
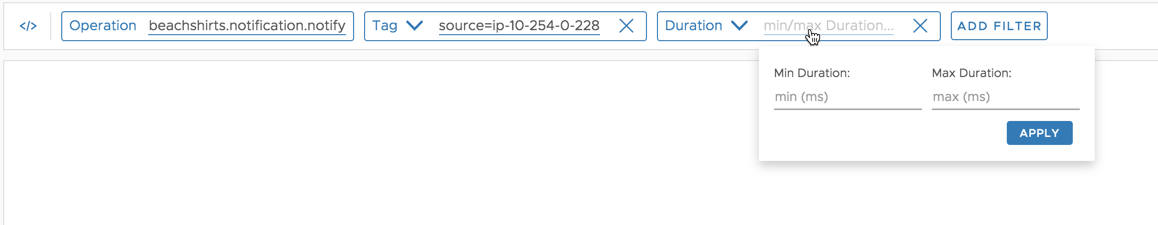
- Type 30 in the Min Duration field and click Apply.
- Click Search to display the results.

Trace Queries in Query Editor
Query Builder works well for many use cases, but sometimes Query Editor is your best option.
 |
Example
The video below (created in 2020) shows you how to get the trace details from the beachshirts application where the spans match the following:
- Spans where the shopping service is the parent span of the inventory service.
- Spans where the inventory service directly follow after the shopping service.
It uses the following queries:
traces(spans(beachshirts.inventory.*).from(spans(beachshirts.shopping.*)))
You can use any of the trace filtering functions to view trace details. To keep query execution manageable, use the limits() function, as shown below.
limit (100, traces(spans(beachshirts.inventory.*).from(spans(beachshirts.shopping.*))))
Trace Query Results
A trace query:
- Finds the spans that match the description you specify.
- Finds the traces that contain at least one matching span.
- Uses duration thresholds (if you specified any) to filter the set of returned traces.
For example, you can query for traces with at least one member span that meets the following criteria:
- Represents an operation called
dispatchthat is performed by a service calleddelivery. - Represents work done on a cluster called
us-west-2. - Is associated with a custom tag
env=production.
If you also specified a minimum (or maximum) duration, the query filters out any traces that are shorter (longer) than the threshold you specified.
Graphic Representation of a Returned Trace
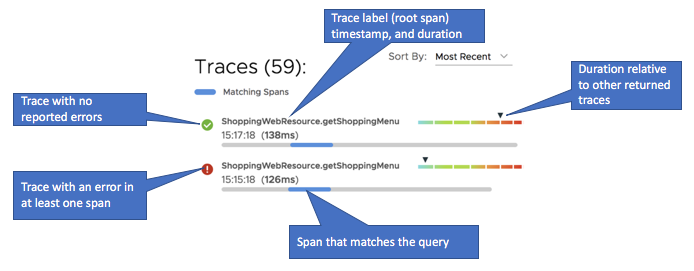
The Traces Browser displays a bar for each trace that is returned by a trace query. The bar’s length visually indicates the trace’s duration. A blue area in the bar indicates where a matching span occurs in the trace, and how much of the trace it occupies:
How the Traces Browser Labels a Returned Trace
Each bar that is returned by a query represents a unique trace that has a unique trace ID. For readability, we label each trace by its root span, which is the first span in the trace. The trace’s label is the name of the operation that the root span represents.
For example, the two returned traces shown above both have a root span that represents work done by an operation called ShoppingWebResource.getShoppingMenu. However, these root spans represent different executions of the operation, with different start times. Although the two root spans have the same operation name, they mark the beginning of two different traces.
getAvailableColors operations. The query could return traces that begin with ShoppingWebResource.getShoppingMenu, if those traces contain a getAvailableColors span.Limit and Sort the Result Set
The browser allows you to fine-tune what you see.
-
Use the Limit filter to limit the number of returned traces and make your query complete faster. The trace query starts by returning the most recent traces. After reaching the limit, the query stops looking for more traces.
Tip: The current time window for the Traces Browser also implicitly limits by the result set. Traces are returned only if they contain a matching span and start in the current time window. -
Sort a set of returned traces by selecting a sort order from the Sort By menu. For example, choose Outliers to start with the traces whose duration is unusually long or unusually short. Or, choose Most Spans to start with the traces that contain the largest number of spans.
If you both limit and sort the query results, sorting applies after limiting. For example, suppose you limit the number of returned traces to 50, and then sort the result set from shortest to longest. The sorted list includes only the 50 traces that were originally returned by the query. We do not first sort all traces containing a matching span, and then display the 50 shortest traces.
The current time window for the Traces Browser also implicitly limits by the result set. Traces are returned only if they contain a matching span and start in the current time window.