VMware Aria Operations for Application (formerly known as Tanzu Observability by Wavefront) supports two tools for working with queries:
- Chart Builder is the fasted way to customize which metrics you see and to display them in charts.
- Query Editor, discussed on this page, allows advanced users to extract exactly the metrics they need from ingested data. If a chart uses functions that are not supported in Chart Builder, or if the chart has been opened in Query Editor before, we show Query editor when you open the chart for edit.
We open Query Editor if:
- Query Editor is the default in your user preferences.
- The chart that you open for edit already open in Query Editor before.
Basics
Query Editor expects that you type the query using the elements of the query language. See Wavefront Query Language Quick Reference for a complete reference - each function links to a reference page.
- Functions for use with histograms
- Functions for use with traces and spans
- Functions for use with events
Open Query Editor
You can set your preferences to use Chart Builder or Query Editor when you open a chart for edit.
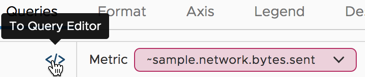
To switch from Chart Builder to Query Editor, click the toggle.
Warning: If you switch to Query Editor and make changes to the query there, you cannot return to Chart Builder.
Construct Queries
You construct queries using Wavefront Query Language.
- Start with the metric that you want to monitor.
- Add filters, e.g.
source=production. - Add one or more query language functions. Execution order makes a difference.
- Use grouping if you’re interested in grouping your metrics. For example, you could use the
sourcesparameter one line for each source in the chart.
Use Chart Variables
You can use variables in dashboards and charts.
- You can use dashboard variables in your queries.
- Chart variables are local to the chart.
Chart variables make it possible to use the result of one query in another query in the same chart using ${query_name} notation.