With dashboards and charts, all VMware Aria Operations for Applications (formerly known as Tanzu Observability by Wavefront) users can examine data. By default, everyone can explore: set dashboard time window, zoom in and out, and perform other customizations.
Video
All users can customize their dashboards to drill down into data. Learn how to find a section, filter using variables or filters, set the time for the dashboard, and share the dashboard with others. You need the Dashboards permission to save your changes. Note that this video was created in 2020 and some of the information in it might have changed. It also uses the 2020 version of the UI.
You can also watch the video here  .
.
Get Started: Dashboard Browser
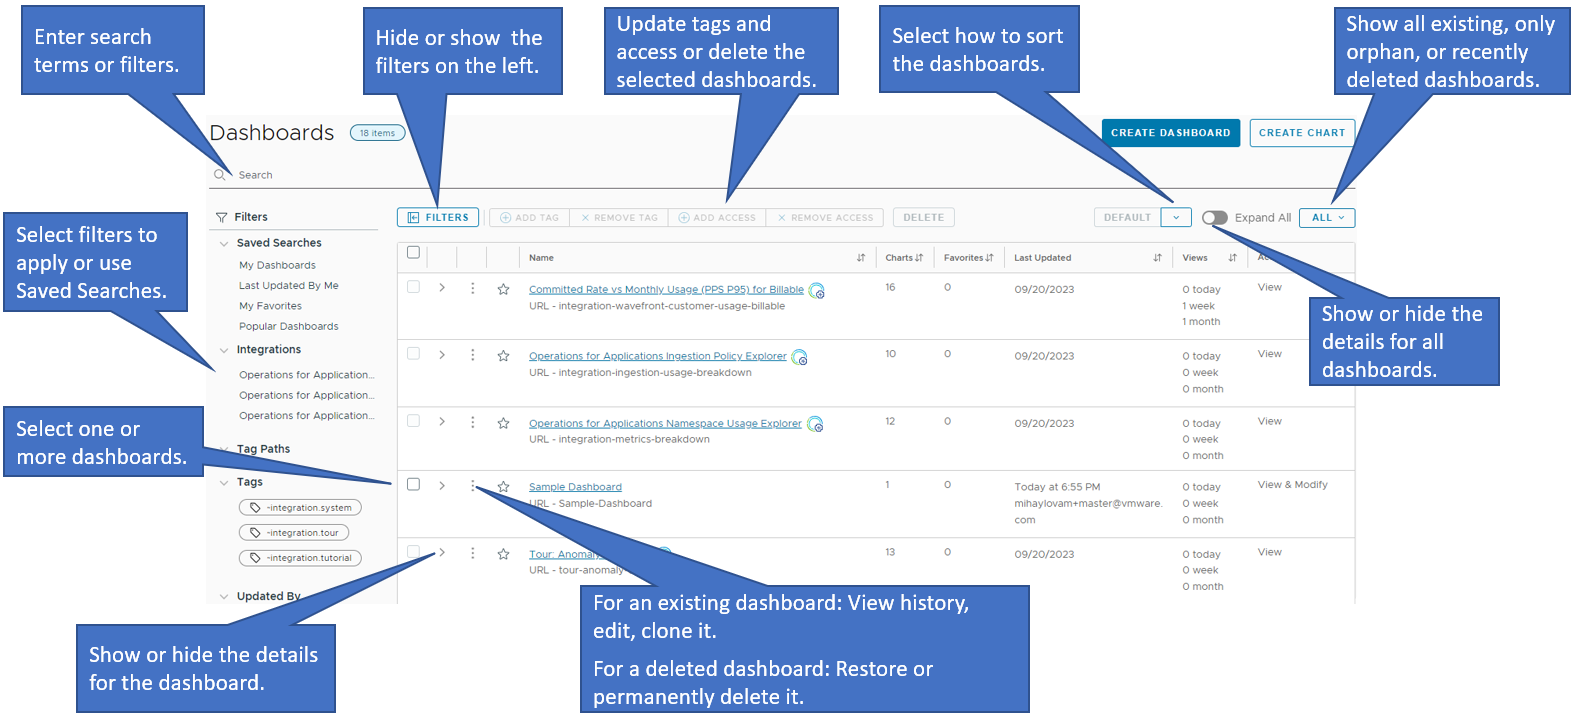
From the Dashboard Browser, you can find dashboards by using filters and tags. You can make a dashboard a favorite with the star icon. Users with Dashboard permissions can also look at versions, grand and remove access, clone dashboards, move a dashboard to the trash, or access a deleted dashboard for up to 30 days.
- Log in to your product instance.
- Select Dashboards > All Dashboards
- In the Dashboard Browser:
- Use the search bar at the top to find a dashboard.
- Use the options on the left to limit what the Dashboard Browser displays.
- Use the three horizontal dots (ellipsis) menu for dashboard management.
- Add new or existing tags to make finding dashboards easier.
- Click the star icon to add the dashboard to your favorites.
- View dashboard tags (or, add or remove them if you have Dashboard permission).
Find a Dashboard
Many users work in environments with a lot of dashboards.
To find a dashboard, you have these options:
- From the toolbar, select Dashboards > All Dashboards and narrow down your search using the fields on the left.
- Select Dashboards > All Dashboards and start typing the dashboard name in the Search field.
- From within a dashboard, use the Search for Dashboards field in the upper right to find other dashboards. The search string matches dashboard name or URL.
Get Started: Dashboards
After you’ve selected a dashboard, it displays in your browser.
- Default time setting default is 2 hours, live data, with a refresh every 30 seconds.
- Refresh rate is determined by the time window. A smaller time window refreshes more often. You can force a refresh.
- Lazy load means that charts refresh as you scroll to them to avoid extra computational burden. Sections can improve load behavior – you can focus on what you need instead of scrolling through charts you don’t want to see.
Here’s the anatomy of a dashboard:
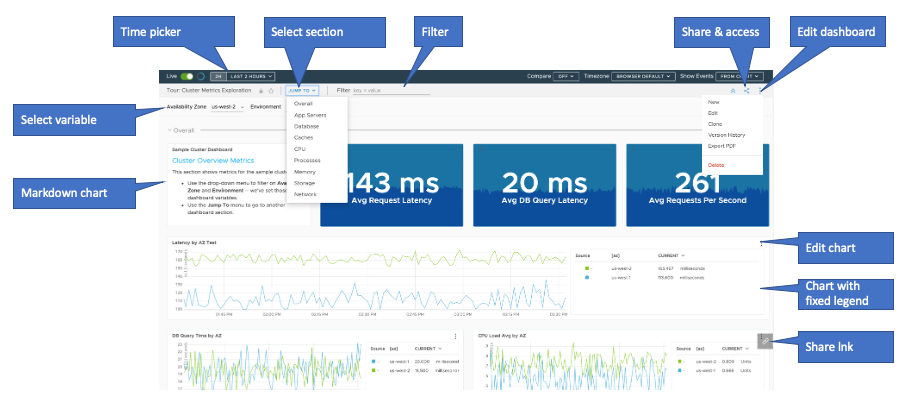
You can customize what you see, open charts, and more.
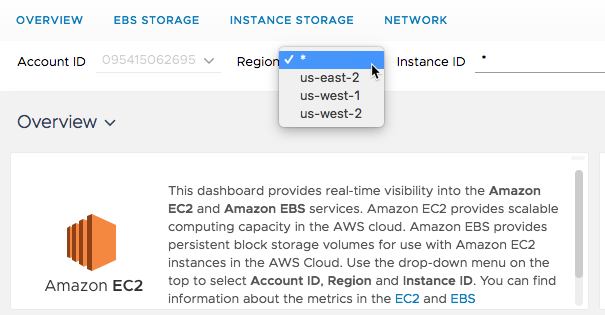
- Select predefined variables or use a filter to limit the display.
- Use the Jump To menu and select a section.
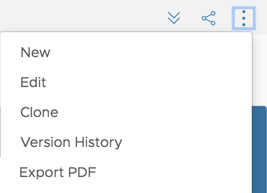
- Use the ellipsis icon menu in the top right to export to PDF, look at the version history, edit or clone the dashboard. Menu options are limited for system dashboards and for users who don’t have Dashboard permission.
- Use the ellipsis icon menu in the top right to delete a dashboard. Deleted dashboards are available for 30 days before they are deleted permanently. To access a deleted dashboard, simply select Dashboards > All Dashboards, and from the menu on the top right of the list of dashboards, select Deleted.
- Share a link to the dashboard (all users) and modify access (Dashboard permission required).
Set the Time Window
This video highlights how you can select, sync, and reset time windows so you can analyze and compare your data. Note that this video was created in 2021 and some of the information in it might have changed. It also uses the 2021 version of the UI.
By default, dashboards:
- Show a two-hour time window in each chart. You can configure the default time window as part of the Dashboard Display Preferences.
- Display real-time (live) data.
- Update charts every 30s.
You can select a larger or smaller time window or view past data instead of real-time data with the time bar controls.
The time window determines how often the charts in a dashboard refresh.
- Charts with a time window of 5-10 minutes reload every second.
- A logs table chart with a 5-10 minute time window reloads every 30 seconds.
- Charts with a larger time window (e.g. 4 hours or 1 day) reload every 30 second.
Temporarily Change the Dashboard Time Window
To change the dashboard time window while you’re investigating the data on the charts and without saving your changes, you can turn on or off live data:
- Click the Live button to turn on (green) live data and see the most recent data on the charts.
- Click the Live button again to turn off live data and to look at past data.
Regardless of the selection, you can also click the Time window picker for a fine-grained time selection window. You can select from a list of preset times or you can set a custom time window.
- Click the Time window picker.
- In the Time window settings window specify the settings that you want.
- Select an option from the preset times.
- Click Custom Time Window, select the start and the end dates and times, and click Apply.
The changes apply to the charts in the dashboard until you close the dashboard.
Permanently Change the Dashboard Time Window
To set the time window settings of a chart and save them, you can:
- Open the dashboard in edit mode.
- From the Time window picker select the new time window.
- To apply your changes, click Save.
You can also set the time window from the Dashboard General Settings window. See change the dashboard display preferences and settings.
See the Current Dashboard Time Window
- Click the Time window picker.
-
In the Time window settings window, you can see the time window settings:
If the settings are selected from the list of preset times, you'll see the time window highlighted. 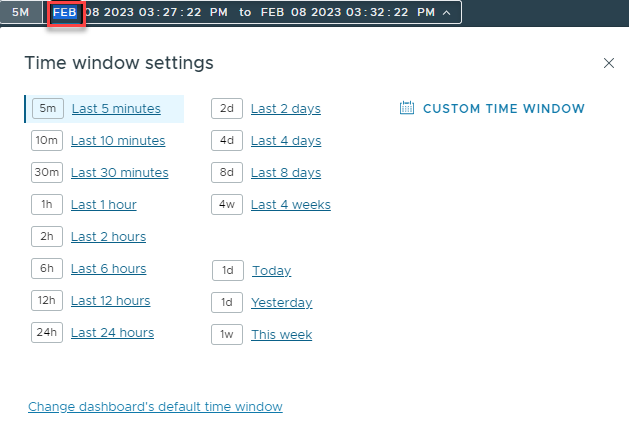
If the settings are custom time window settings, you'll see them when you click Custom Time Window. 
Navigate to a Section in the Dashboard
Most dashboards have several sections. They’re easy to access from the Jump To menu.
| Use the Jump To menu to go to a section. | 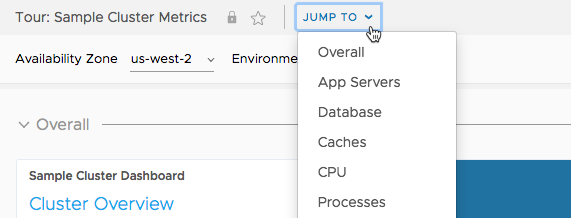 |
Filter with Global Filters or Dashboard Variables
Global filters and dashboard variables are two ways to narrow down what you see.
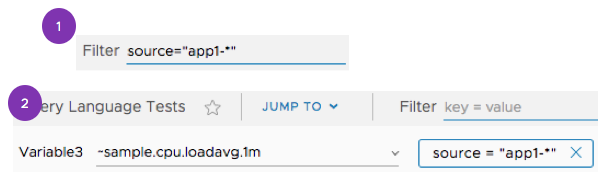
- Global Filters allow any user to filter by key-value pair. For example, you could specify
source="db-2"orenv="production". - Dashboard Variables are preset by a user with Dashboard permissions. All users can then make selections, for example, select a value from predefined list of strings or an automatically generated list of sources.
If you select both a variable and a global filter, the query engine uses AND to find results that satisfy both conditions. For example, source="db-2" AND source="db-1" results in No Data, but other combinations might get the results you’re after.
Filter with Global Filters
All users can use global filters to customize their dashboard. When you set a global filter, for example, to limit to certain sources, you affect all charts in the dashboard.
Global filters allow any user to:
|
 |
Use Dashboard Variables
If a dashboard has preconfigured dashboard variables, you can use them to filter the information displayed in all charts.
To show or hide the Variables bar:
|
 |
To select a variable:
|
 |
Include or Exclude Obsolete Metrics
By default, obsolete metrics are not included in the charts unless you explicitly decide to include these metrics. You can:
- Explicitly include obsolete metrics for each chart.
- Explicitly include obsolete metrics on a dashboard level. This way, obsolete metrics will be included in all the charts within a dashboard.
To include obsolete metrics for a chart:
- Open the chart for edit.
- Click the Advanced tab and select the Include Obsolete Metrics check box.
- Explore the data or, if you have Dashboard permissions, click Save to save the changes for this chart.
To include obsolete metrics for a dashboard:
- Navigate to a dashboard and click the ellipsis icon in the top right corner of the dashboard.
- Select Edit.
- Click Settings.
- Click Advanced and select the Include Obsolete Metrics check box.
- Click Accept and explore. If you have Dashboards permission click Save to save your changes.
To exclude obsolete metrics for a dashboard:
Dashboards on which inclusion of obsolete metrics is turned on have a warning banner which allows you to easily turn off that setting.

- Navigate to the dashboard and click View Settings in the banner at the top. Refresh your browser if you closed the banner.
- Click Advanced.
- Deselect the Include Obsolete Metrics check box.
- Click Accept and explore. If you have Dashboards permission click Save to save your changes.
Isolate Sources or Series
You can focus on a particular source or series in the dashboard view or the single-chart view. The selected sources or series show up at the bottom of the browser window.
To isolate sources and aggregated series, you can click a series in a chart:
- Hover over the series you want to isolate. The series you hover over displays as saturated and all other series are dimmed.
- Click the series. An isolation bar appears at the bottom of the browser window.

To isolate multiple series on all charts, hold down the Windows or Command key and repeat.
- If a series is related to a single source, it appears in the Sources: list. When you isolate a source, every series in the dashboard containing that source is isolated.
- If a series represents an aggregation of sources, it appears in the Series: list. When you isolate a series, the query field name displays in the isolation bar and every series in the dashboard with that query field name is isolated.
To remove an isolation, click the X icon next to the series at the bottom of the browser window.
Fine-Tune the Time Window
You can fine-tune the time window for an individual chart, propagate the time window from one to all charts, and reset a customized time window to the dashboard default.
When you fine-tune the time window, the UI dynamically recalculates and updates the chart bucket size and the aggregated values based on the selected summarization option.
| Process | Description |
|---|---|
| Time Bar | Click the chart time bar in the upper-right corner of a chart. Use the magnifying lenses to quickly increase or decrease the time window.
 |
| Zoom in | Place your cursor at the beginning of the time window you want, and click and drag. Hold the Shift key to zoom in on all charts in a dashboard.
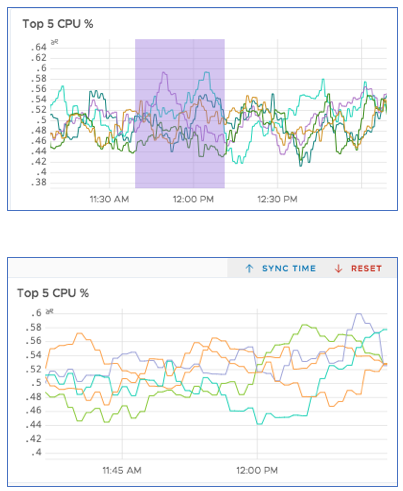 |
| Shift the time window | Place the cursor over the X-axis. When the cursor changes to a 4-way arrow , hold and drag to the left or right. To shift the time windows of all charts on a dashboard, hold down the Shift key while dragging. You can move the time window into the future. However, unless you are using one of the predictive functions, the data you see won’t be predictive. |
| Propagate time to all charts | To propagate a chart time window to all other charts on the dashboard:
|
| Reset chart time | If you’ve changed the time window in one chart and want to return to the default time used by other charts in the dashboard, click Reset next to the chart time selector:  |
Here’s a video that illustrates chart time windows. Note that this video was created in 2021 and some of the information in it might have changed. It also uses the 2021 version of the UI.
Display Events on Charts
The charts in your dashboard can display events.
- The service generates system events, for example, when an alert changes state.
- In addition, users with Events permission might have added user events.
All users can select which events are displayed for all charts.
| The Show Events drop-down menu in the upper right of the toolbar allows you to toggle event overlays on the X-axis of charts. |
 |
Drill into Logs from Charts
If you have the Logs permission, you can drill into logs from charts, for example, if you notice data anomalies on a chart and want to debug the issue.
- Even if logging is enabled for your environment, this feature might have to be enabled separately. Contact technical support.
- You must have tagged the metrics and the logs from the same source with equivalent source tag values. If your metrics and logs tags don’t match, to map the metrics tags to logs tags, see Customize Logs Settings.
To drill into the related logs from a chart:
- Position your pointer over the metric (on the location of the anomaly).
- Right-click that point on the chart and select Logs.
Note: This feature supports only one source filter. If you selected more than one source on the chart, you only see one source on the Logs Browser (the source that comes first when the source name is alphabetically sorted).
 In this example, you right-click the metric chart for source
 db-5 at 01:25 PM.
The Logs Browser opens in a new tab with the following configuration:
- The search time window is a 10-minute period, starting 5 minutes before and ending 5 minutes after the time of the point that you right-clicked on the chart.
- The search query includes the
sourcetag as a filter for the source that you right-clicked.
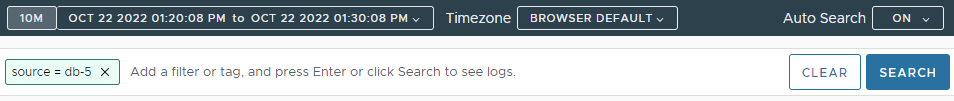 In this example, the Logs Browser opens with the filter
 source = db-5 and the time window 01:20 PM to 01:30 PM (starting 5 minutes before and ending 5 minutes after 01:25 PM).
 |
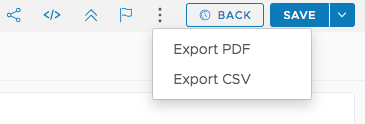
Export to CSV or PDF
- You can export what you see in a dashboard or chart to PDF.
- You can export charts to CSV, regardless of whether the chart is in Edit mode.
|
 |
|
 |
|
 |
Do More!
In addition to examining time series data, drilling down on exactly the information you need, creating alerts, etc., you can also
- View histogram metrics.
- Examine traces, spans, and RED metric sent by your application.
- See Application Status.
- See Service Dashboard.
- See Traces Browser.
- For an in-depth discussion, see Troubleshooting Missing Data.