VMware Aria Operations for Applications (formerly known as Tanzu Observability by Wavefront) supports smart alerts that dynamically filter noise and capture true anomalies.
- When the alert condition is met, an alert notifies one or more alert targets, which receive the alert notification(s).
- The alert notification includes an image and a link to see the alert in context.
- Look all alerts in the Alert Browser or examine a single firing alert in the Alert Viewer.
How Alerts Work
This section starts with a video and explores the anatomy of an alert. Go to one of the tutorials if you’re ready to start examining alerts right away.
How Alerts Work Video
In this video, Clement explains how a single-threshold alert works. Note that this video was created in 2018 and some of the information in it might have changed.
Anatomy of an Alert
An alert consists of these main components:
| Alert Condition | The Alert Condition is all about the behavior you monitor, as a query. For example you could check the CPU average or network bytes received. On the **Alerting** page, the alert condition is the currently selected query. In multi-query alerts, you can define several queries and use the results of these queries in the condition query, but only the currently selected query is used as the condition. |
| Alert Target | The Alert Target can be an email or Pagerduty key, or the alert creator can specify a custom alert target. |
| The Alert Notification goes to all alert targets that you've specified for a given severity. Many alerts use one of the predefined notification formats, or the alert creator can customize the alert notification, which uses Mustache syntax |
How Are Alerts Evaluated?
To understand the alert evaluation process, review Alert States and Lifecycles, or watch videos in the Alerting Videos playlist on VMware TV.
Some commonly misunderstood concepts include:
-
Alert checking frequency: Default is 5 minutes. You can adjust this property from the Additional Settings in the Conditions section of the alert.
-
Alert time window being reviewed: Default is 5 minutes. You can change the time window with the Trigger Window and Resolve Window properties.
-
Minutely summarized values are being evaluated: If your conditional query returns more than 1 value per minute, then the query engine perform minutely aggregation using
align()before it evaluates the alert query. -
Required number of TRUE values needed to trigger an alert: A TRUE value is any non-zero value returned by your alert query. Within the reviewed time window, an alert triggers if there is at least 1 TRUE value and 0 FALSE values. A FALSE value is any zero value returned by your alert query.
- The alert is triggered only by a TRUE value. An absence of a value is considered neither TRUE nor FALSE.
- A TRUE value is not required at each reporting interval for an alert to trigger.
-
Alerts evaluate on real-time data: Reviewing data associated with a triggered alert may appear different than it did when the alert was evaluated in real-time. This can be caused by delayed reporting of data or by the query construct. Reviewing the alert query in a Live 10-minute chart often sheds light on this behavior.
How Often Are Alerts Evaluated?
The default Checking Frequency interval is 5 minutes. You can adjust this property from the Additional Settings in the Conditions section of the alert.
- If your alert condition query runs for more than a minute, consider increasing the checking frequency interval. For example, if the query runs for 4-6 minutes, set the Checking Frequency interval to 7 minutes.
- If your data points are coming much less frequently than once a minute, consider increasing the checking frequency interval. For example, if the query metrics report every 10 minutes, set the Checking Frequency interval to 10 minutes.
- If an alert condition uses larger moving time windows or aligns to a large interval, you can check less frequently. For example, an alert that compares a
mavg(6h, ...)tomavg(48h, ...)can be safely checked once an hour or even less. - If an alert is non-critical, you can check only as often as needed.
Alert Viewer Tutorial
Alert Viewer is for investigating a single alert.
When you receive an alert notification, it includes a link to the alert in Alert Viewer. The related information in Alert Viewer can help you determine what’s going on.
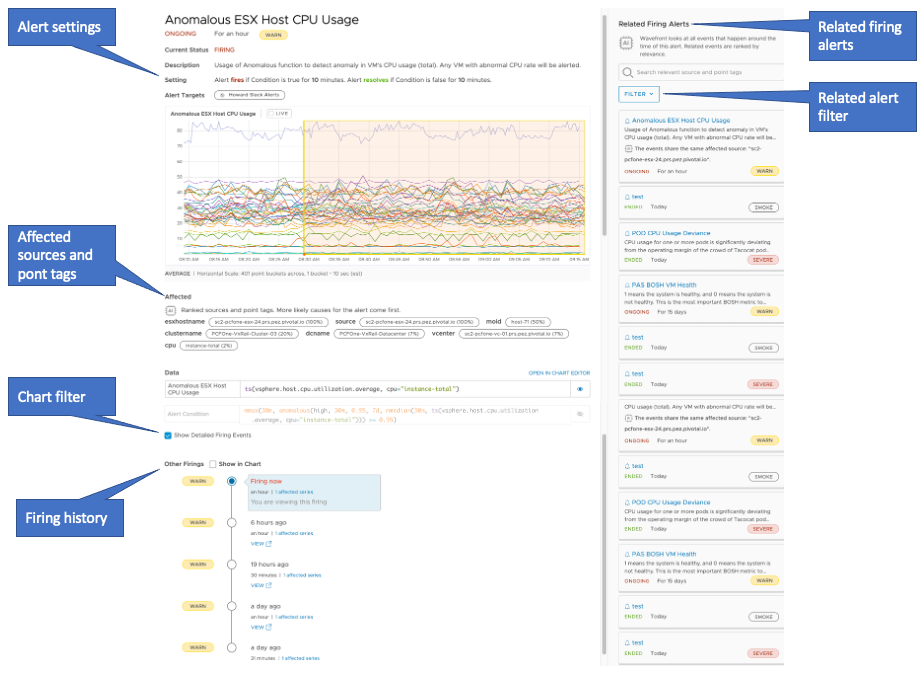
Step 1: Connect and Get the Big Picture
|
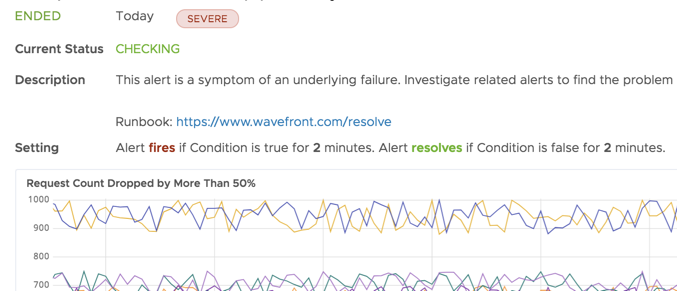
Click the link in the alert notification and start with the 10-second briefing in the top left. Learn about:
|
 |
Step 2: Examine Related Firing Alerts
| In the top right, examine Related Firing Alerts. When an alert fires, we scan all the other alerts that have fired within 30 minutes and correlates them with the initial event using AI/ML algorithms. You can filter by alert severity. |
 |
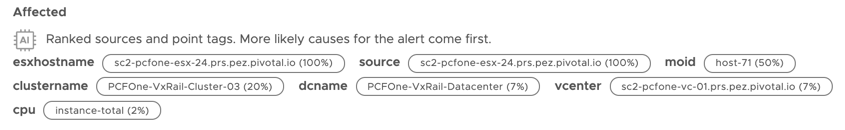
Step 3: Investigate Affected Point Tags and Sources
|
Scroll down and examine the Affected section on the left. When an alert fires, we analyze the point tags that are most likely to be related to the firing alert and displays them in ranked order in the Alert Viewer. These point tags are a list of suspects for why the alert is firing. For example, if the alert is caused by an outage in region=us-west-2, this tag is ranked higher than other tags. |
 |
Step 4: Learn From Other Firings
| Other Firings shows past firings of the same alert with a link to the corresponding firing in the Alert Viewer. For multi-threshold alerts, you can see the severity. Click the links to see details. | 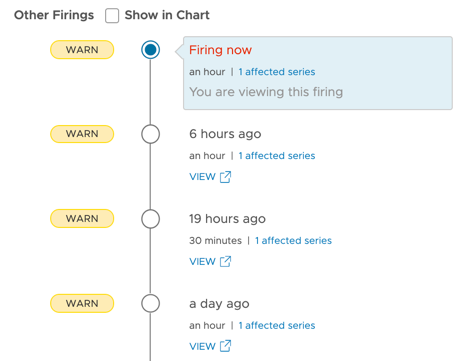 |
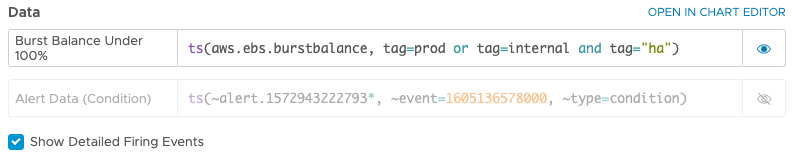
Step 5: Explore Alert Data
| Scroll to the Data section. You can have a first look at the alert query, filter what's displayed, and open the alert query. |
 |
Alert Viewer Video
In this video, Pierre gives a 2-minute tour of Alert Viewer. Note that this video was created in 2019 and some of the information in it might have changed. It also uses the 2019 version of the UI.
Alerts Browser Tutorial
You can view and manage all alerts in the Alerts Browser.
The Alerts Browser allows you to
- search and sort alerts
- filter, for example, to see only firing alerts,
- organize alerts by state, properties, and alert tags.
Step 1: Go to Alerts Browser
|
On any page in the GUI, a colored dot next to Alerting indicates that there are firing alerts. The color shows the alert severity.
|
 |
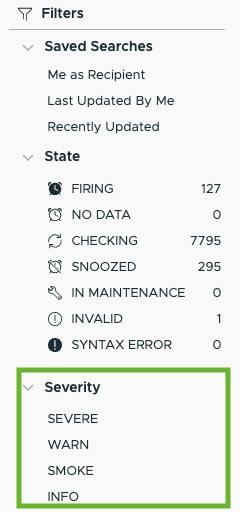
Step 2: Filter Alerts in Alerts Browser
|
By default, the Alerts Browser shows all alerts for your cluster. To find exactly the alerts that you need you can:
|
 |
Step 3: Examine an Alert in Alerts Browser
You can expand each alert to view detailed information. For example, when you expand an alert that is firing, the detailed information looks like this:

Follow these steps for a tour:
- Click the ellipsis icon to the left for a menu.
- Click the chart icon under the State column for alert details. If the alert is firing, click to examine the alert in Alert Viewer.
- View the alert condition and points.
- View details below the severity:
- View the last affected series, including the affected sources and point tags.
- View the targets. For multi-threshold alerts, you see this information for each severity.
- Examine alert tags. You can add a tag to make filtering for the alert easier.
Step 4: View Alert Version History
To access the version alert history, click the ellipsis icon on the left of the alert in the Alerts Browser and click Versions.
|
Alert version history shows:
. |
 |
Step 5: Organize Related Alerts with Tags
You can use alert tags to organize related alerts into categories. Alert tags are especially useful for setting up maintenance windows. You can:
- Search or filter the list of alerts in the Alerts Browser to show only a category of alerts.
- Suppress a category of alerts during a maintenance window.
- Reference a group of alert metrics in a single expression.
|
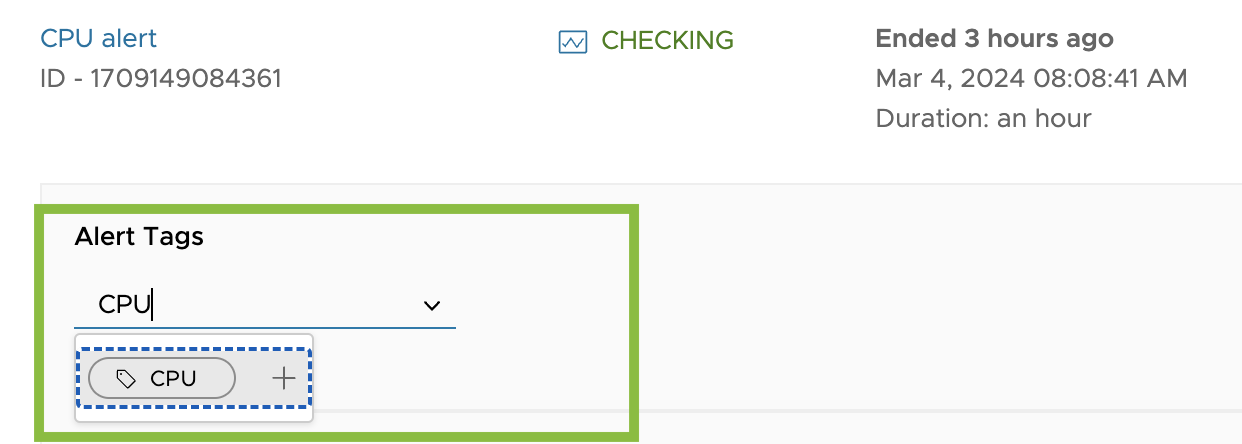
To add a new or existing alert tag at any time:
For example, you might assign tags like networkOps, underDevelopment, and eastCoast. All users can later search for one or more of these tags to find any other alerts that are in the same category or combination of categories. Note: If you want to add a new tag in the revamped Alerts Browser, enter the name of the tag and click plus icon next to the new tag name.
|
|
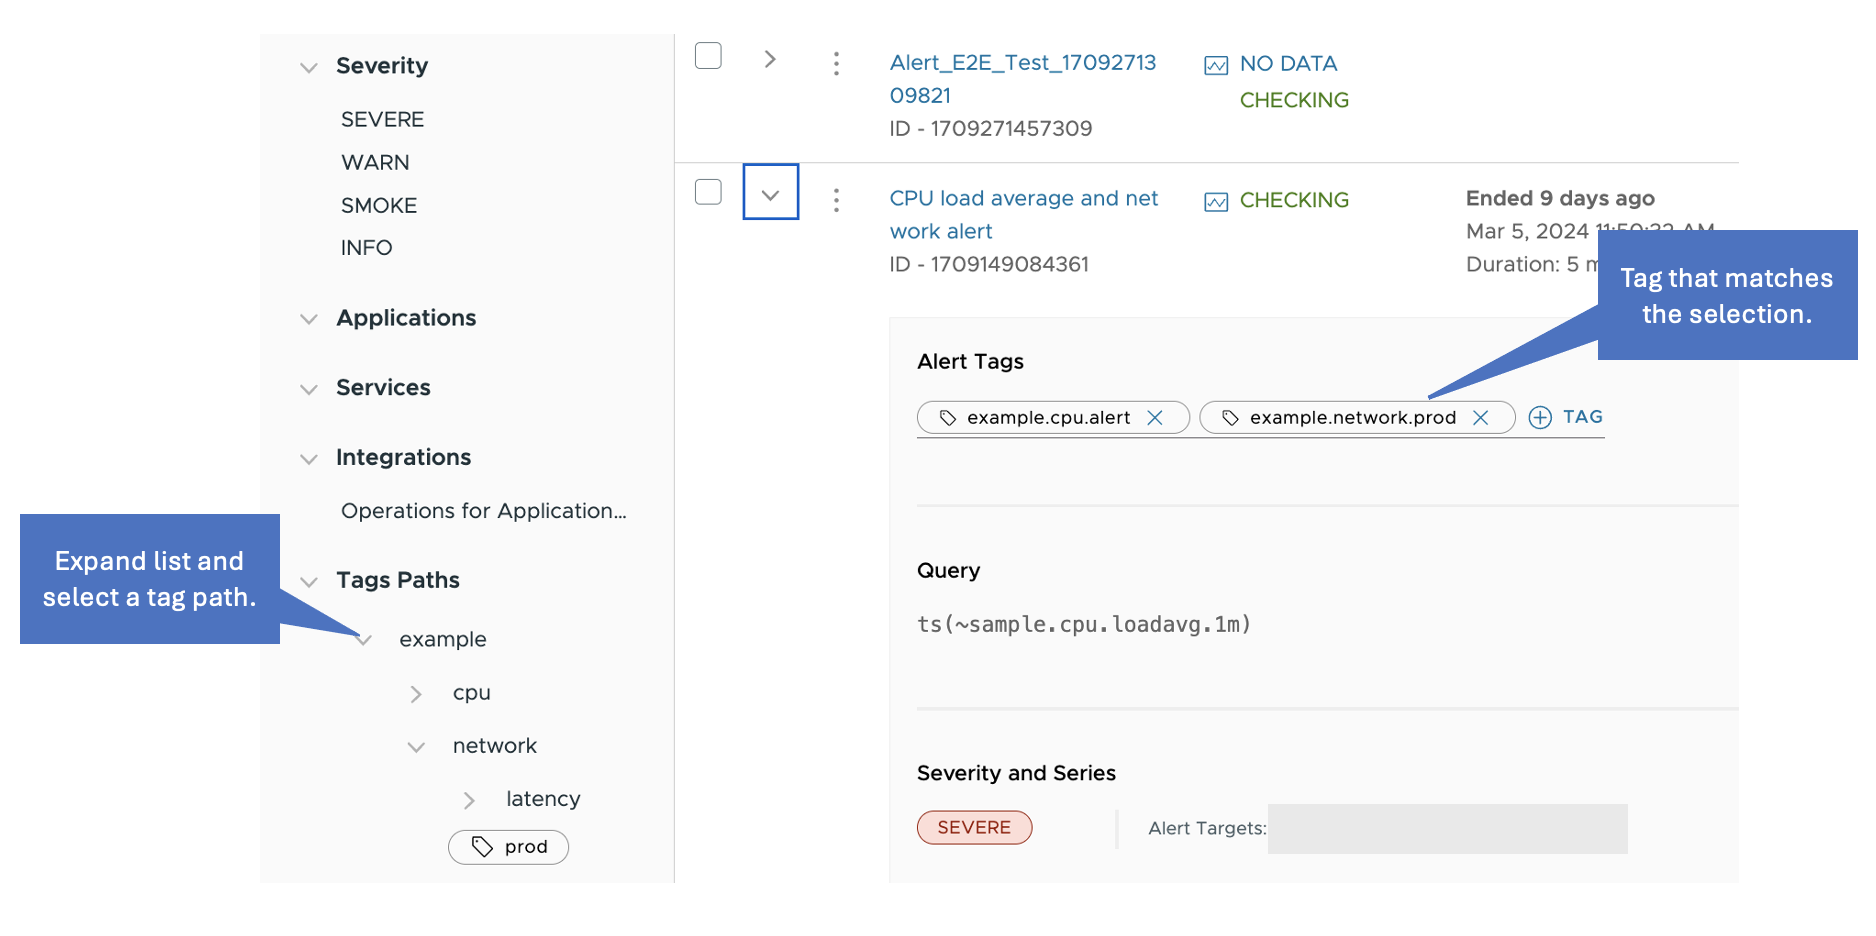
Step 6: (Optional) Use Multi-Level Alert Tags
If your environment has a nested set of categories, you can use alert tag paths. For example, suppose you have created a group of alerts that you use as demo examples, and:
- Within the demo group, some alerts monitor network activity.
- Within each subgroup, some alerts monitor production applications.
To manage these alerts, you assign the tag paths example.network.prod and example.latency.prod. The Alerts Browser below shows the tag paths as a hierarchy under Tag Paths on the left. You can click example and then network to view all alerts that have a tag path that starts with example.network.
When you create a maintenance window, you can use a wildcard to match tag path components:
example.*.*matches the entire group of demo alerts.example.latency.*matches all of the alerts that monitor request latency.example.*.prodmatches all of the production alerts.
When you have many and complex tag paths, you can search them by parent. For example, if you have the tag paths example.network.prod, example.network.dev, example.latency.prod, and example.latency.dev, you can perform a search by example and the search returns all of its children.
Clone an Alert
To make copies of an existing alert, then change the copy, you can clone an alert.
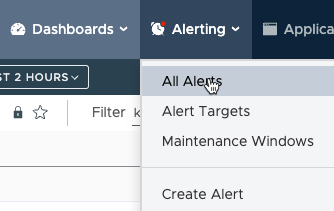
- From the toolbar, select Alerting > All Alerts.
- Click the ellipsis icon next to the alert.
-
Select Clone, provide a new name for the alert and click Clone.
The new alert opens in edit mode.
- Customize the clone to suit your needs and click Save.
Alert Events
We create events as alerts fire, update, and resolve. You can optionally display those events as icons on a chart’s X-axis:
![]()
Do More!
- Watch videos in the Alerting Videos playlist on VMware TV.
- Create and manage alerts.
- See answers to Frequently Asked Questions
- Learn about alert states and life-cycle.
- For troubleshooting, look at our Alerts FAQ page:
- If you want to update multiple alerts, See How Do I Bulk Update Alerts with the API and How Do I Bulk Update Alerts with the CLI.
Note: The CLI is not maintained by VMware and is not officially supported.