VMware Aria Operations for Applications (formerly known as Tanzu Observability by Wavefront) is committed to continuous improvement of product accessibility. We recently addressed accessibility issues and included level-A accessibility fixes for keyboard navigation and colorblind support. We also addressed several level-AA accessibility issues. Here are some highlights:
- Keyboard shortcuts allow you to navigate through pages and menus without using a mouse.
- Color contrast supports colorblind accessibility. We continuously check our UI elements and change color as needed.
Accessibility Improvements
Starting with the 2021-26.x release, we included these accessibility improvements:
- More color contrast improvements to support colorblind accessibility, for example in all charts and dashboards, including operational and service dashboards.
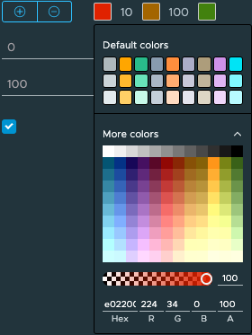
- A redesigned color picker with a new color palette.
-
Light UI theme:

-
Dark UI theme:

-
- Keyboard navigation support in more UI pages.
- Drag-and-drop functionality that allows you to rearrange items.
UI Pages With End-to-End Keyboard Navigation Support
The end-to-end keyboard navigation is fully supported in the UI pages listed below. The documented way for navigating to the respective page is provided as an example, because you can access these pages in multiple ways.
-
Dashboards Browser page
You can access it by navigating to Dashboards > All Dashboards from the toolbar.
-
Dashboard page
You can access it by navigating to a specific dashboard from the Dashboards Browser page.
-
Create a dashboard wizard
You can access it by navigating to Dashboards > Create Dashboard from the toolbar.
-
Alerts Browser page
You can access it by navigating to Alerting > All Alerts from the toolbar.
-
Alert Viewer page
You can access it by navigating to a specific alert from the Alerts Browser page.
-
Events list page
You can access it by navigating to Browse > Events from the toolbar.
-
Chart page
You can access it by navigating to a specific chart from the Dashboard page or by navigating to Dashboards > Create Chart from the toolbar.
-
Integrations list page
You can access it by navigating to Integrations from the toolbar.
-
Kubernetes integration page
You can access it by navigating to Kubernetes from the Integrations list page.
-
Sources Browser page
You can access it by navigating to Browse > Sources from the toolbar.
-
Maintenance Windows page
You can access it by navigating to Browse > Maintenance Windows from the toolbar.
-
User profile page
You can access it by navigating to your profile from the gear icon on the toolbar.
-
Metrics Browser page
Navigate to Browse > Metrics from the toolbar.
Drag-and-Drop Keyboard Navigation
The drag-and-drop keyboard navigation is available when you create or edit charts and when you create or edit metrics security policies.
To use the drag-and-drop navigation:
- To enter drag mode, press spacebar.
- Use the arrow keys to move the item, for example a query line.
- Press spacebar to drop the item in its new position.
With the drag-and-drop keyboard navigation you can rearrange:
- Query lines
- Functions within a query line in Query Editor
- Variables
- List values when you add variables to a dashboard
- Metrics Security Policy rules
Keyboard Shortcuts and Their Usage
| Keyboard Shortcut | Allows you to: |
|---|---|
| Tab and Shift+Tab | Navigate forward and backward through the UI elements on a page level. Also allow you to navigate through UI elements such as text boxes and the Query Editor. |
| Arrow keys |
|
| Home and End keys or Cmd+Up and Cmd+Down for Safari | Navigate to the first and last main menu item, respectively, when the focus is on any main menu item. |
| Enter | Perform the action the element is meant to do. For example, if the element is a button, pressing Enter is the same as clicking the button. Pressing Enter when the element is a link, opens the link. |
| Esc or Opt+Esc for Safari | Close a pop-up window or any opened menu, such as a drop-down menu, or an ellipsis icon menu. Returns you to the parent or closest interactive element if the current component disappears. Always orients you on the page post an action. |
| Spacebar | Select or deselect a check box, click a button, and enter drag-and-drop mode.
|
| Shift | Show the entire raw data for a chart legend.
Change the time window of all charts in a dashboard. For example, you can zoom in or zoom out one of the charts and press the Shift key at the same time. The time window changes will apply to all charts in the dashboard for which the time window settings are set to Default to dashboard time window. |
| Ctrl or Command for Safari | Temporarily hide the legend when you hover over a chart. |
| Ctrl+Click | Selectively highlight the metrics in a chart, based on series or sources. |