Examining events directly in charts can help you correlate metric anomalies with the events. This page explains how you can display an event overlay with details about the event, and customize the overlay.
You save any of these events settings from the GUI, but can make the settings persist by setting the value in the dashboard JSON file.
Event Overlay Example
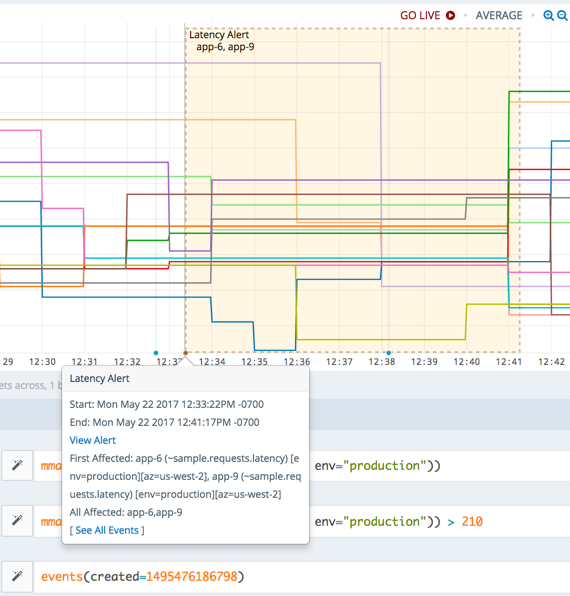
The example below shows an event overlay that includes a link to the alert that generated it and other information about the event.
Event Overlay Types and Color
Different events display in different ways:
- If a single event occurs in a time interval, the event icon displays as a dot on the chart’s X-axis.
- If two or more events occur in a time interval, the event icon displays as a star on the X-axis.
- Instantaneous events display a vertical line and non-instantaneous or ongoing events display a shaded region that represents the duration of the event.

The event severity determines the color of the overlay:
- SEVERE - red
- WARN - orange
- SMOKE - gray
- INFO - blue
Control Event Overlays
Events can make your charts look cluttered. There are several options to control what’s shown on a chart:
- Options for individual charts
- Options that apply to the whole dashboard
Configure Event Overlays for Individual Charts
There can be alert generated system events, or events that are manually created by a user. For details, see Event Sources and Types. You can configure a chart to show specific events.
| Action | Results |
|---|---|
|
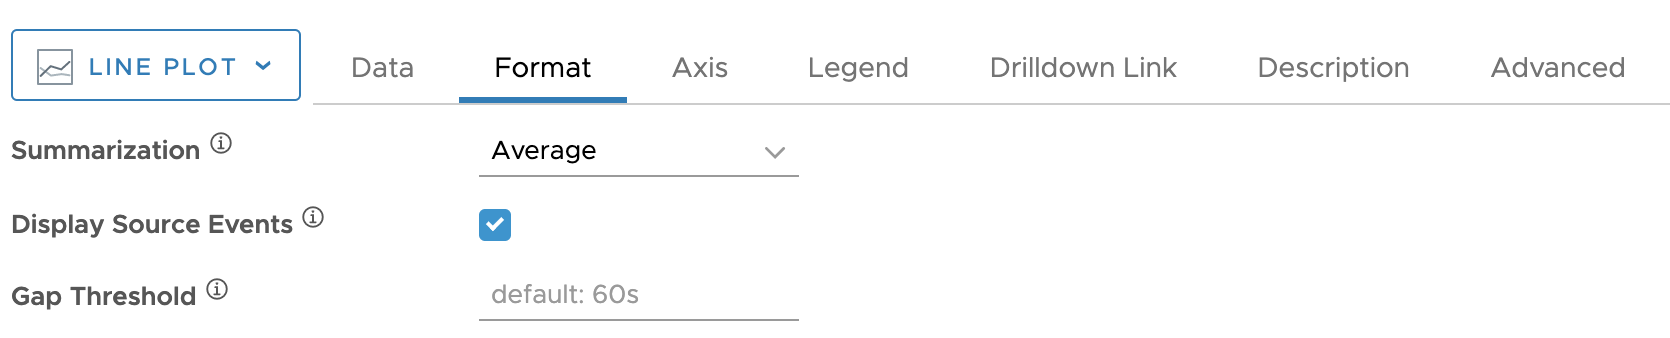
Display events based on source events: Select the Display Source Events check box in the chart’s’ Format tab to display events related to alerts that fired for sources in the chart. For example, if the query used in the chart uses metrics that have the application source tag, and these applications have events related to alerts that fired, you see these marked on the chart. See Metric Data Format for details. |
|
|
Add an events() query to view specific events on a chart: Add an events() query to the chart. An events() query cannot be the only query on a chart. At least one ts() query must be enabled on the chart so that the events() query results display.
For example, events(name="Latency Alert" and type="alert") shows all the warning events on your chart.
|

|
Specify an Events() Query for a Dashboard
| Action | Results |
|---|---|
|
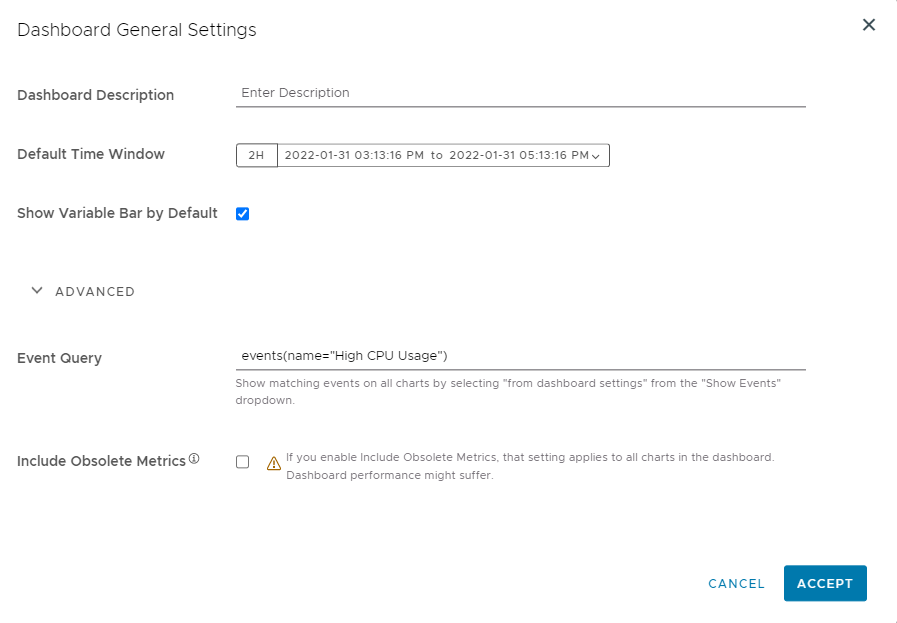
Set an events() query in dashboard preferences, which you can access using the ellipsis menu in the top right corner of the dashboard.
For example, events(name="High CPU Usage") shows events that have the name High CPU Usage on all the charts of the dashboard.
|
|
View Events on Dashboards and Charts
Let’s look at how you can view the events you added to the charts and dashboards in the above examples using the Show Events drop-down menu in the top right.
| Show Events Options | Results |
|---|---|
From Chart: Displays events based on the selection of the Display Source Events checkbox and the events() query in a chart.
|

|
From Dashboard Settings: Displays events based on the events() query specified in dashboard settings. The source events are not displayed in this option.
|

|
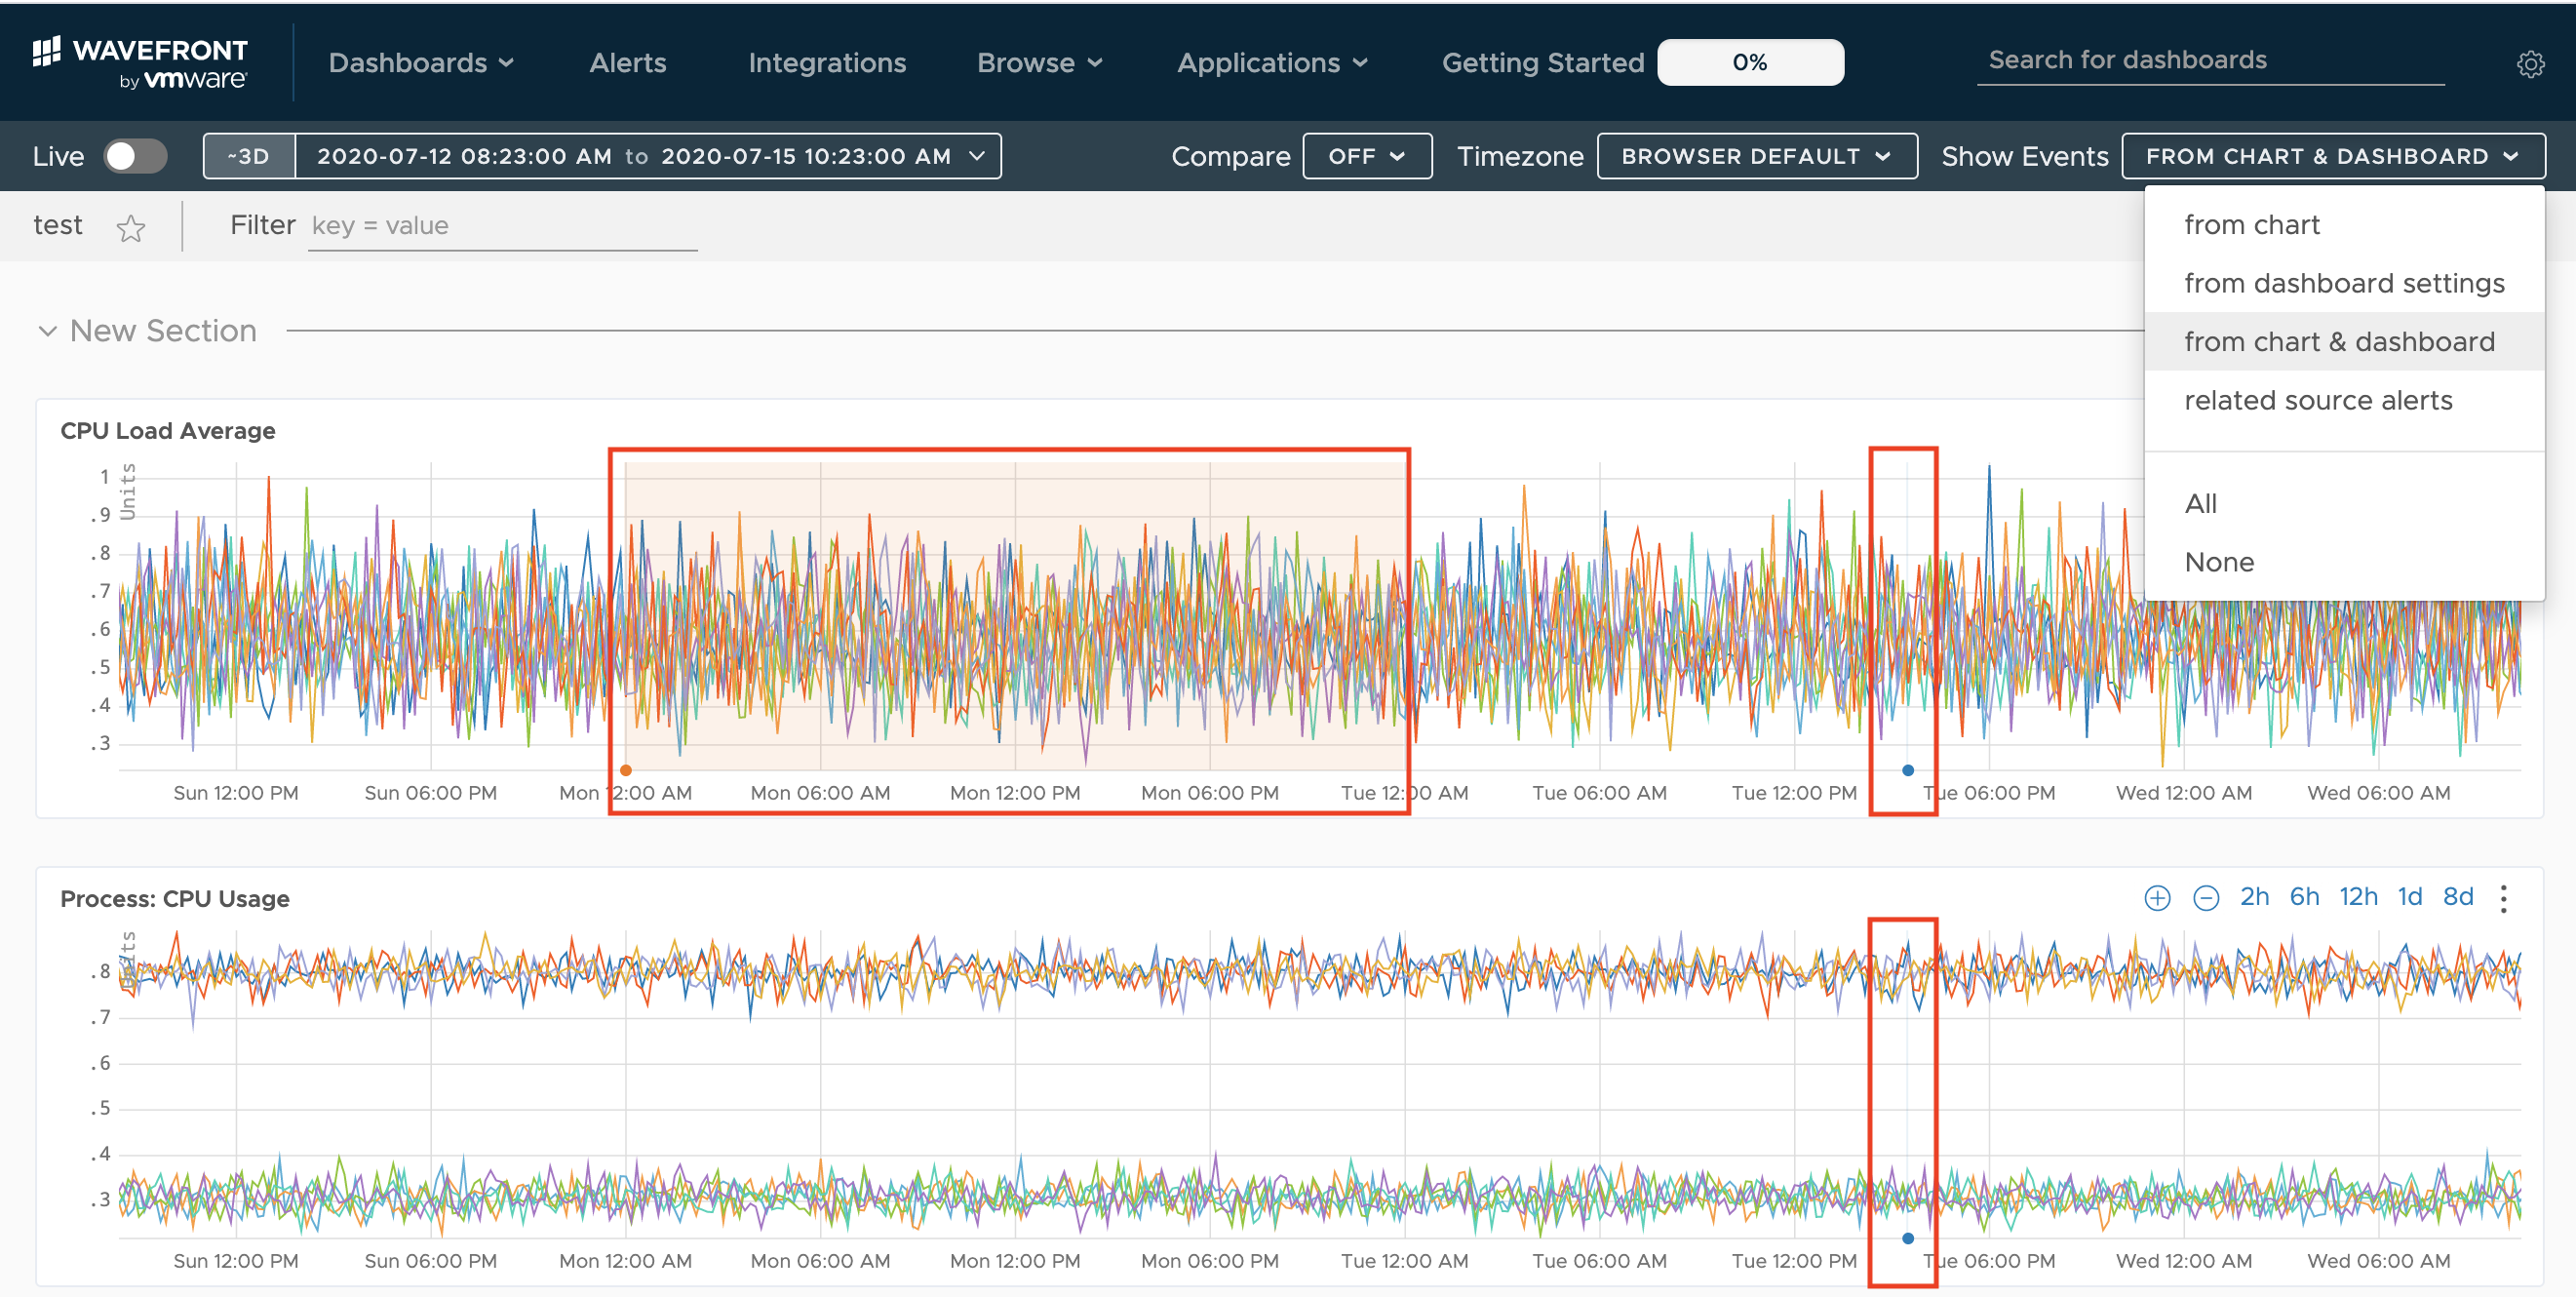
From Chart & Dashboard: Displays events based on the selection of the Display Source Events checkbox and the global events() query specified in dashboard settings.
|
|
| Related Source Alerts: Displays the events that were generated by alerts associated with sources of the charts. |

|
| All: Displays all events that have occurred within the time window associated with the chart windows. |

|
| None: Hides all events from every chart in the dashboard (default setting). |
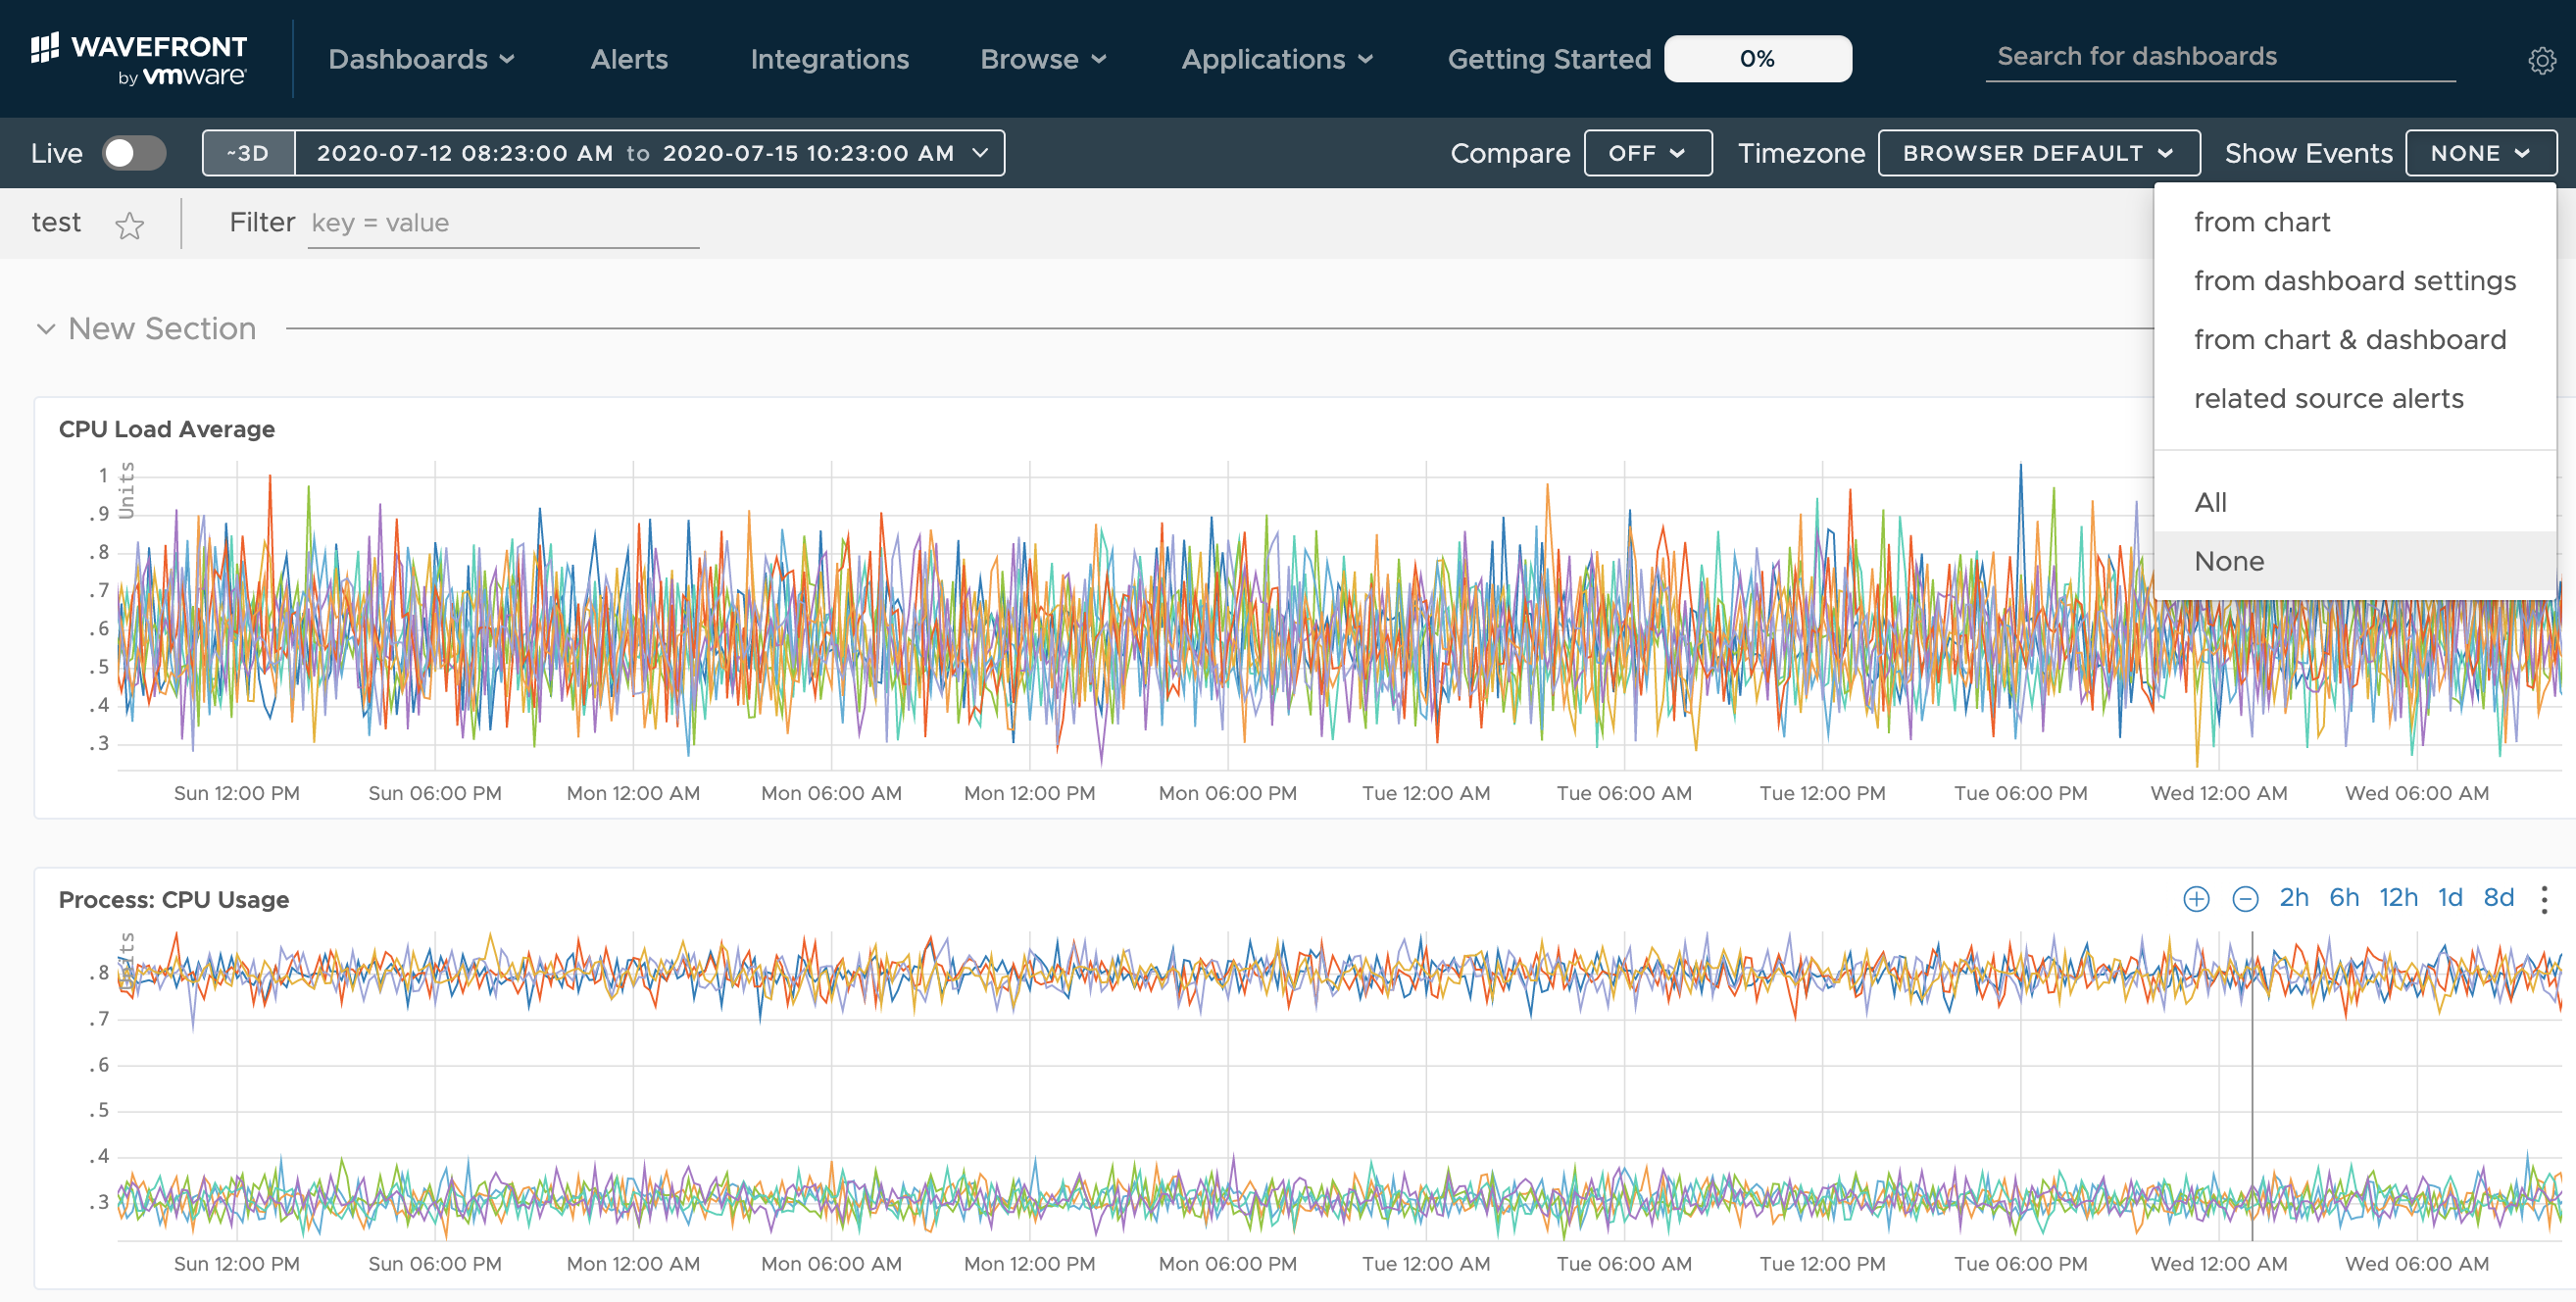
|
Set Event Overlays Permanently
You cannot save the event overlay settings from the GUI, but can make the change in the dashboard JSON file.
To set event overlay defaults for a dashboard
-
Open the dashboard JSON file for edit.
-
Set
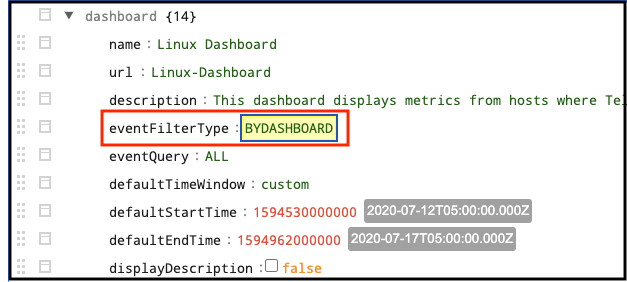
eventFilterTypesetting to one of the following and save the JSON. Going forward, the Show Events setting for this dashboard defaults to the setting specified ineventFilterType.
  BYCHART = from charts
  BYDASHBOARD = from dashboard settings
  BYCHARTANDDASHBOARD = from chart and dashboard
  AUTOMATIC = related source alerts
  ALL = all
  NONE = none
For example, to set the Show Events setting to from dashboard settings, set eventFilterType : BYDASHBOARD as shown in the following screenshot.