Here’s a video to get you started with the alerts lifecycle in VMware Aria Operations for Applications (formerly known as Tanzu Observability by Wavefront). Note that this video was created in 2017 and some of the information in it might have changed. It also uses the 2017 version of the UI.
What’s the Alert Lifecycle?
The alert lifecycle determines:
- Which events the alert triggers, and which alert targets get notifications.
- When notifications are sent to which target.
When Do Multi-Threshold Alerts Notify Alert Targets?
A multi-threshold alert supports multiple severities with different alert targets. Each time the alert fires, it notifies all alert targets for each severity that has a condition that’s met.
Let’s look at an example:
| ts expression | ts(cpu.loadavg.1m) |
| operator | > |
| SEVERE | 6000 |
| WARN | 5000 |
| SMOKE | 4000 |
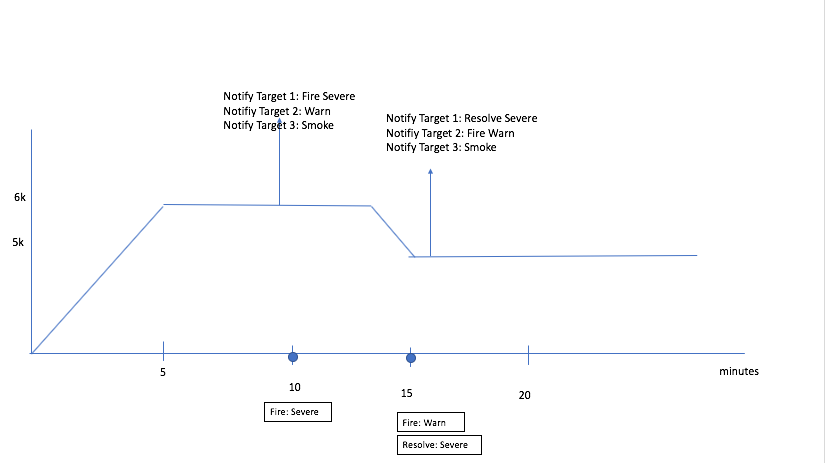
This multi-threshold alert notifies targets like this:
- Operations for Applications monitors the alert condition.
- If at least one of the threshold values is met for the specified amount of time, for example, if
cpu.loadavg.1mis greater than 6000, the alert fires. - Notifications are always sent to all alert targets that match the condition, for example, that are equal to or below the severity that triggers the alert. For example, if
cpu.loadavg.1mis greater than 6000 for 5 minutes, alert targets for SEVERE, WARN, and SMOKE are notified because the condition is satisfied for all. If the value ofcpu.loadavg.1msatisfies the WARN but not the SEVERE condition, then only alert targets in WARN and SMOKE will be notified. - We continue checking the alert condition at the specified interval (5 minutes by default). If the alert condition for a higher level is no longer met, but lower-level conditions are still met, then the higher-level alert target gets an Alert Resolved notification, and each lower-level alert target gets an Alert Updated notification.
When Do Single-Threshold Alerts Notify Alert Targets?
Single-threshold alerts notify all targets at the same time when the alert changes state:
- Operations for Applications monitors the alert condition. When the condition is met for the specified amount of time, the alert fires.
- When the alert fires, we send alert notifications to the alert target(s) specified for the alert, using the severity that’s prespecified for the alert.
- When the alert resolves or is snoozed, we send additional notification to the alert target(s).
What are Alert States?
An alert can be in one of the following states, shown in the Alerts Browser and Alert Viewer:
| Alert State | Description |
|---|---|
| CHECKING | Operations for Applications checks whether the Condition is met for the amount of time specified by the Trigger Window property. If an alert is in the FIRING state, it cannot be in the CHECKING state at the same time but Operations for Applications checks firing alerts to determine if firing conditions are still met. A FIRING alert resolves and transitions back to CHECKING when the condition does not evaluate to true in the time window, or when the time window contains no data. |
| FIRING | The alert meets the Condition for the amount of time specified by the Trigger Window property. An alert transitions to FIRING when the condition has at least one true value and no false values during a fixed time window. |
| NO DATA | The series for which an alert is defined is not reporting data. You can set up an alert that triggers if the alert is in a NO DATA state for a specified amount of time. If you do, select Alert Has No Data in the corresponding Alert Target. For those alert targets, select Alert Has No Data Resolved if you want to send a notification when the alert exits the NO DATA state. |
| IN MAINTENANCE | The alert is associated with a maintenance window.
|
| INVALID | The alert is timing out ( > 5 min query execution) or queries include inactive metrics or sources. When an alert is in the INVALID state, it is checked approximately every 15 minutes, instead of the specified checking frequency (see next section). |
| SYNTAX_ERROR | The alert condition query resulted in a syntax error. This can happen, for example, if the query does not use quotes around query elements (e.g. sources or point tag values) that include special characters. |
| SNOOZED | The alert is not checked because the user set it to SNOOZED. |
When Are Alerts Checked?
The data associated with an alert are checked to determine whether the alert should fire or not. The default checking frequency is 5 minutes. You can change this interval by setting the Checking Frequency advanced property.
The exact time of the check for a particular alert is not fixed and can vary slightly within the minute. For example, it’s possible that a check for a specific alert occurs at 1:01:17pm and the next check occurs at 1:06:13pm.
Data Granularity for Alert Checking
The data granularity for alert checking is 1 minute. The alert checking process:
- Evaluates the expression you specified in the alert condition.
- Implicitly aligns the returned values by grouping them into 1-minute buckets.
- Summarizes the values within each bucket by averaging them, and aligns each result at the beginning of the minute that contains the summarized values.
- Evaluates each average value as true (non-zero) or false (zero).
If the expression returns a single data value per minute, the summarization values and the returned values are the same.
align() function, with parameters specifying a 1-minute time window and your preferred summarization method, in your alert condition. See Example 2 below.The examples given below assumes that the alert checking frequency is set to 1 minute.
Example 1
Suppose your alert condition is ts(my.metric) > 4 and my.metric reports 5 data values (9,9,9,3,9) between 12:11:00pm and 12:11:59pm. The alert checking process:
- Compares each reported value to the condition.
- Returns a 1 (true) or 0 (false) for each value.
- Produces a single summarization data point at 12:11:00pm.
The value of this summarization point is .8:
(((1+1+1+0+1) / 5) = .8)
This value (.8) evaluates to true because .8 != 0.
Example 2
Suppose you want to return an entire summarized minute value as false if there’s at least 1 false value present. You can explicitly bucket the values by changing your alert condition to use align():
align(1m, min, ts(my.metric) > 4).
When my.metric reports the data values (9, 9, 9, 3, 9) between 12:11:00pm and 12:11:59pm, the alert checking process:
- Compares each value to the condition (>4)
- Returns a true (1) or false (0) value.
The align() function returns the minimum value (0) as the single value at 12:11:00pm. For that summarized minute value, the alert checking process returns false because 0 = 0.
How Does the Check Time Window Work?
The time window that we evaluate at each checking frequency interval depends on the state of the alert:
- When an alert is currently not firing, the Trigger Window property determines the time window that is evaluated.
- When an alert is currently firing, the Resolve Window property determines the time window that is evaluated.
The data points that are evaluated during an alert check time window are the 1-minute summarizations described above. For example, if the Trigger Window property is set to 3 minutes, then the alert check evaluates 3 summarization data points, one for each minute in the check time window.
The last summarization data point to be evaluated in an alert check time window is determined by the following formula:
alert check time (rounded down to nearest minute) - 1 minute
This formula is used to ensure that the alert has a full minute’s worth of reported data to summarize and evaluate.
Example
Suppose the Trigger Window property is set to 5 minutes, and the alert check time is 1:09:32pm:
- The last summarization data point to be evaluated is at 1:08:00pm
((1:09:32 - 0:00:32) - 0:01:00). This point is the average of the data values that were returned by the alert query from 1:08:00pm to 1:08:59pm. - The 5-minute time window includes the 5 summarization data points from 1:04 - 1:08. These points cover the data values returned from 1:04:00pm through 1:08:59pm.
When Do Alerts Fire?
An alert fires when its condition evaluates to at least one true value and zero false values present within the given Trigger Window time window.
Alert Firing: Example
Suppose the alert condition is ts(my.metric) > 4 and Trigger Window is 2 minutes:
- If the metric reports exactly one data value (5) in the last 2 minutes, and no other points (no data), the alert fires.
Reason: The Trigger Window window contains one true summarization value (5 > 4) and no false values. - If the metric reports many points in the last 2 minutes, and all points are <= 4, the alert does not fire.
Reason: The Trigger Window window contains two false summarization values, because the averages of values that are <= 4 are also <= 4. - If the metric reports many points in the last 2 minutes, all of which are > 4, the alert fires.
Reason: The Trigger Window window contains two true summarization values and no false values, because the averages of values that are > 4 are also > 4. - If the metric reports exactly two data values (5 and 3), anywhere in the last 2 minutes, the alert does not fire.
Reason: The Trigger Window window contains one false summarization value. If each data value is in a different minute, then one of the summarization values is 3, which evaluates to false. If both data values are in the same minute, then their average (4) evaluates to false (4 > 4 is false).
Alert checks are based on data that is summarized every minute. Consequently, if ts(my.metric) returns 5, 5, and 3 in the same minute, the summarized value (4.33) evaluates to true for that minute because 4.33 > 4, even though 3 by itself evaluates to false (3 !> 4). All alert queries are checked according to the Checking Frequency property.
Viewing Firing Alerts
|
The filter bar at the left of the Alerts Browser shows the number of firing alerts by severity. For multi-threshold alerts, we list each alert only for the highest severity even if lower severity conditions are also met. Click FIRING to filter the list of alerts. |
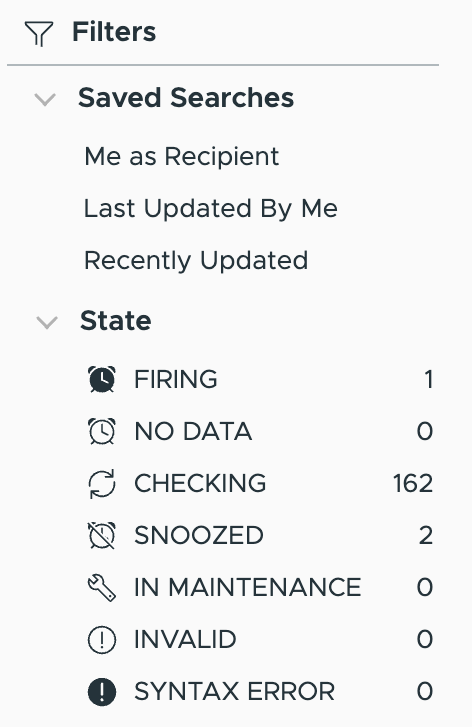 |
When Do Alerts Resolve?
An alert resolves when:
- Either there are no true values present within the given Resolve Window time window
- Or the Resolve Window time window contains no data.
By default, the Resolve Window is the same length as the Trigger Window.
Alert Resolution Example
Suppose you define an alert with the following properties:
- The alert condition is
ts(metric.name) > 0, wheremetric.namereports once a minute. (The summarization values are therefore the same as the reported values.) - The Checking Frequency interval is 1 minute (the default value is 5 minutes).
- Trigger Window = 5 minutes.
- Resolve Window = 10 minutes.
Here’s how the alert might fire, and then resolve:
metric.namenormally reports 0, but starts reporting 1 at 10:21.- At 10:26, the alert fires, because
metric.namehas reported 1 during the 5 whole minutes (from 10:21 to 10:25) immediately before the alert check at 10:26. - At 10:26,
metric.namestarts reporting 0 again. It stops reporting for a few minutes of no data, and then continues reporting 0. - At 10:36, the alert resolves, because
metric.namehas reported 0 during the 10 whole minutes (from 10:26 to 10:35) immediately before the alert check at 10:36.

Did My Alert Misfire?
The alert checking process decision is based on the values that are actually present at the time of the alert check.
- If all metrics report their data points on time, then alert checking bases its decisions on a complete picture of your data.
- Sometimes, however, the alert checking process must evaluate temporarily incomplete data when deciding whether to fire or resolve. The resulting alert decision might produce:
- An apparent false positive, e.g., an alert that fires, but later looks like it shouldn’t have.
- An apparent false negative, e.g., an alert doesn’t fire, but later looks like it should have.
If you suspect an apparent false positive or negative, you can:
- Check for delayed data reporting.
- Adjust your alert condition to prevent the alert from responding until data reporting is complete.
Alert Lifecycle Example
Suppose the threshold for an alert is set to 50%, and the alert’s settings are Trigger Window = 2 minutes, Resolve Window = 2 minutes, and Checking Frequency = 1 minute.
In the chart below:
- An event window from 09:34 to 09:35 identifies the interval during which the metric crossed the threshold going up.
- An event window from 09:39 to 09:40 identifies the interval during which the metric crossed the threshold going down.
- The alert fires around 09:37:09 and resolves at 09:41:59.
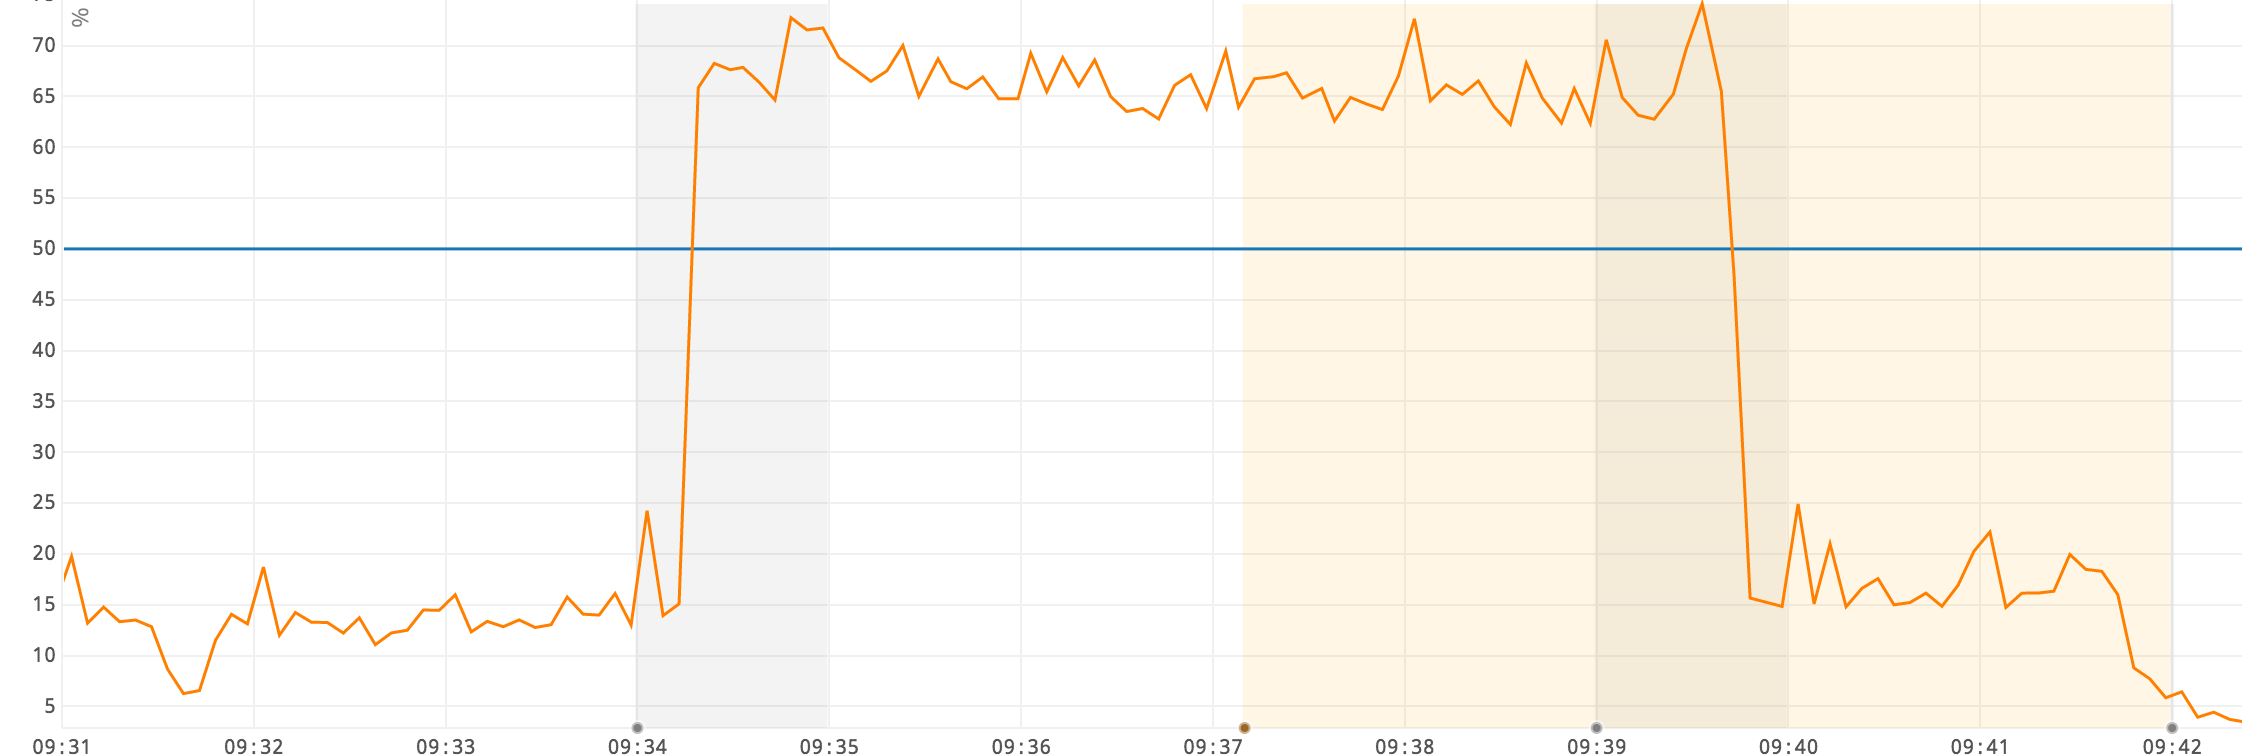
Why does the alert fire when it does?
- An alert check occurs at 09:37:09, and takes into account the 2 summarization data points at 09:35 and 09:36. Each summarization data point evaluates to true, because it is the average of values that are all > 50%.
- The alert fires because the alert check finds two true values and no false values among the summarization data points in the time window.
Why does the alert resolve when it does?
- An alert check occurs at 09:41:59, and takes into account the 2 summarization data points at 09:39 and 09:40. Each summarization data point evaluates to false:
- The summarization point at 09:40 is the average of values (all <= 50%) that were reported from 09:40 to 09:40:59.
- The summarization point at 09:39 is the average of the values (some > 50%, some <= 50%) that were reported from 09:39 to 09:39:59. The resulting average is 44%, which makes the summarization value false (44% <= 50%).
- The alert resolves because the alert check finds at no true values among the summarization data points in the time window.