Distributed tracing enables you to track the flow of work that is performed by an application as it processes a request. This can help you find errors and performance problems in your code.
In an application that consists of multiple services, an incoming request typically starts a chain of requests that are propagated from one service to the next. Distributed tracing gives you end-to-end visibility into that chain across services, even when those services are running in different environments.
In VMware Aria Operations for Applications (formerly known as Tanzu Observability by Wavefront), you can use the tracing dashboards and browsers to:
- Monitor your application to make sure its response times are as expected.
- Troubleshoot and analyze reported errors.
- Pinpoint the specific operations that bottlenecks occur in.
Distributed Tracing Videos
Watch these videos to listen to our co-founder Clement Pang introduce distributed tracing, and give updates including improved ingestion options and intelligent sampling. Note that these videos were created in 2019 and 2020 and some of the information in them might have changed.
Instrument Your Application
OpenTracing is deprecated. (OpenTracing and OpenCensus have merged to form OpenTelemetry.) To send trace data to Operations for Applications, use OpenTelemetry.
If your application uses an OpenTelemetry SDK, you can configure the application to send trace data to the Wavefront proxy

Visualize Distributed Tracing Data
You can visualize the trace data that you collect from your instrumented application with several dashboards and browsers. We show information on your applications and services, and you can navigate from one dashboard to another to see more detail:
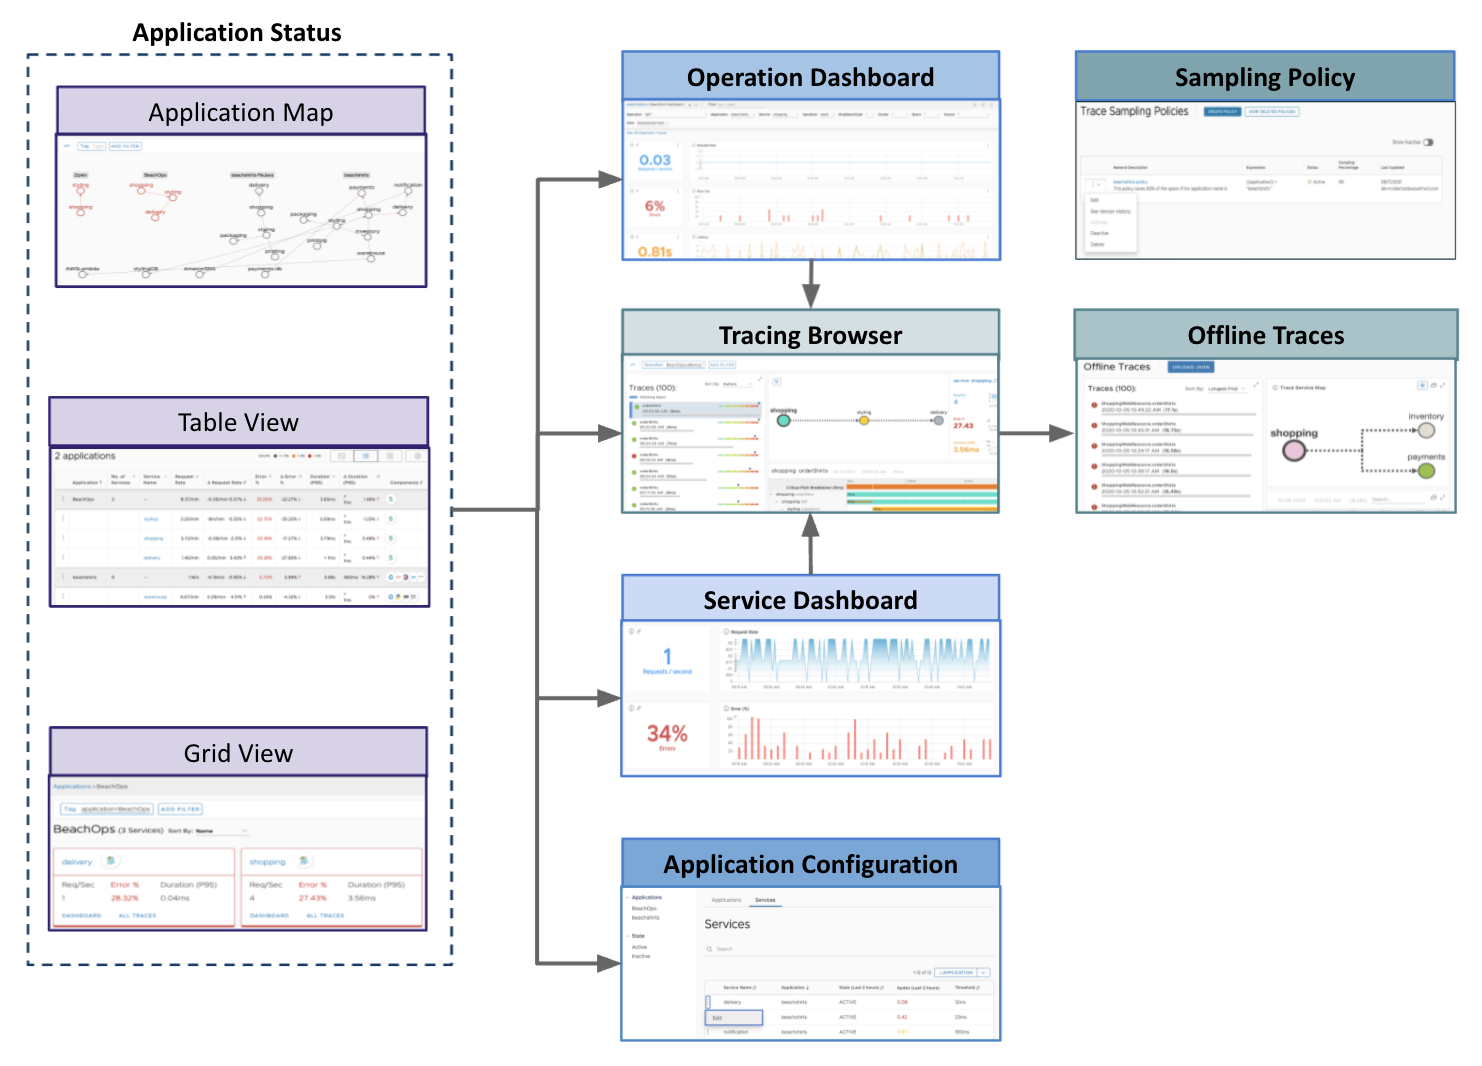
Examine Applications Using Application Status
Get an overview of how the applications and services are linked, understand the health of each service, and troubleshoot when your applications or services run into issues. You can get an overview and see the overall health of each application using the application map, table view and grid view. See Application Status.
-
Application Map view gives you an overview of how the applications and services are linked. You can focus on a specific service, view Request, Error, and Duration (RED) metrics for each service and see the tracing traffic, including the traffic direction.

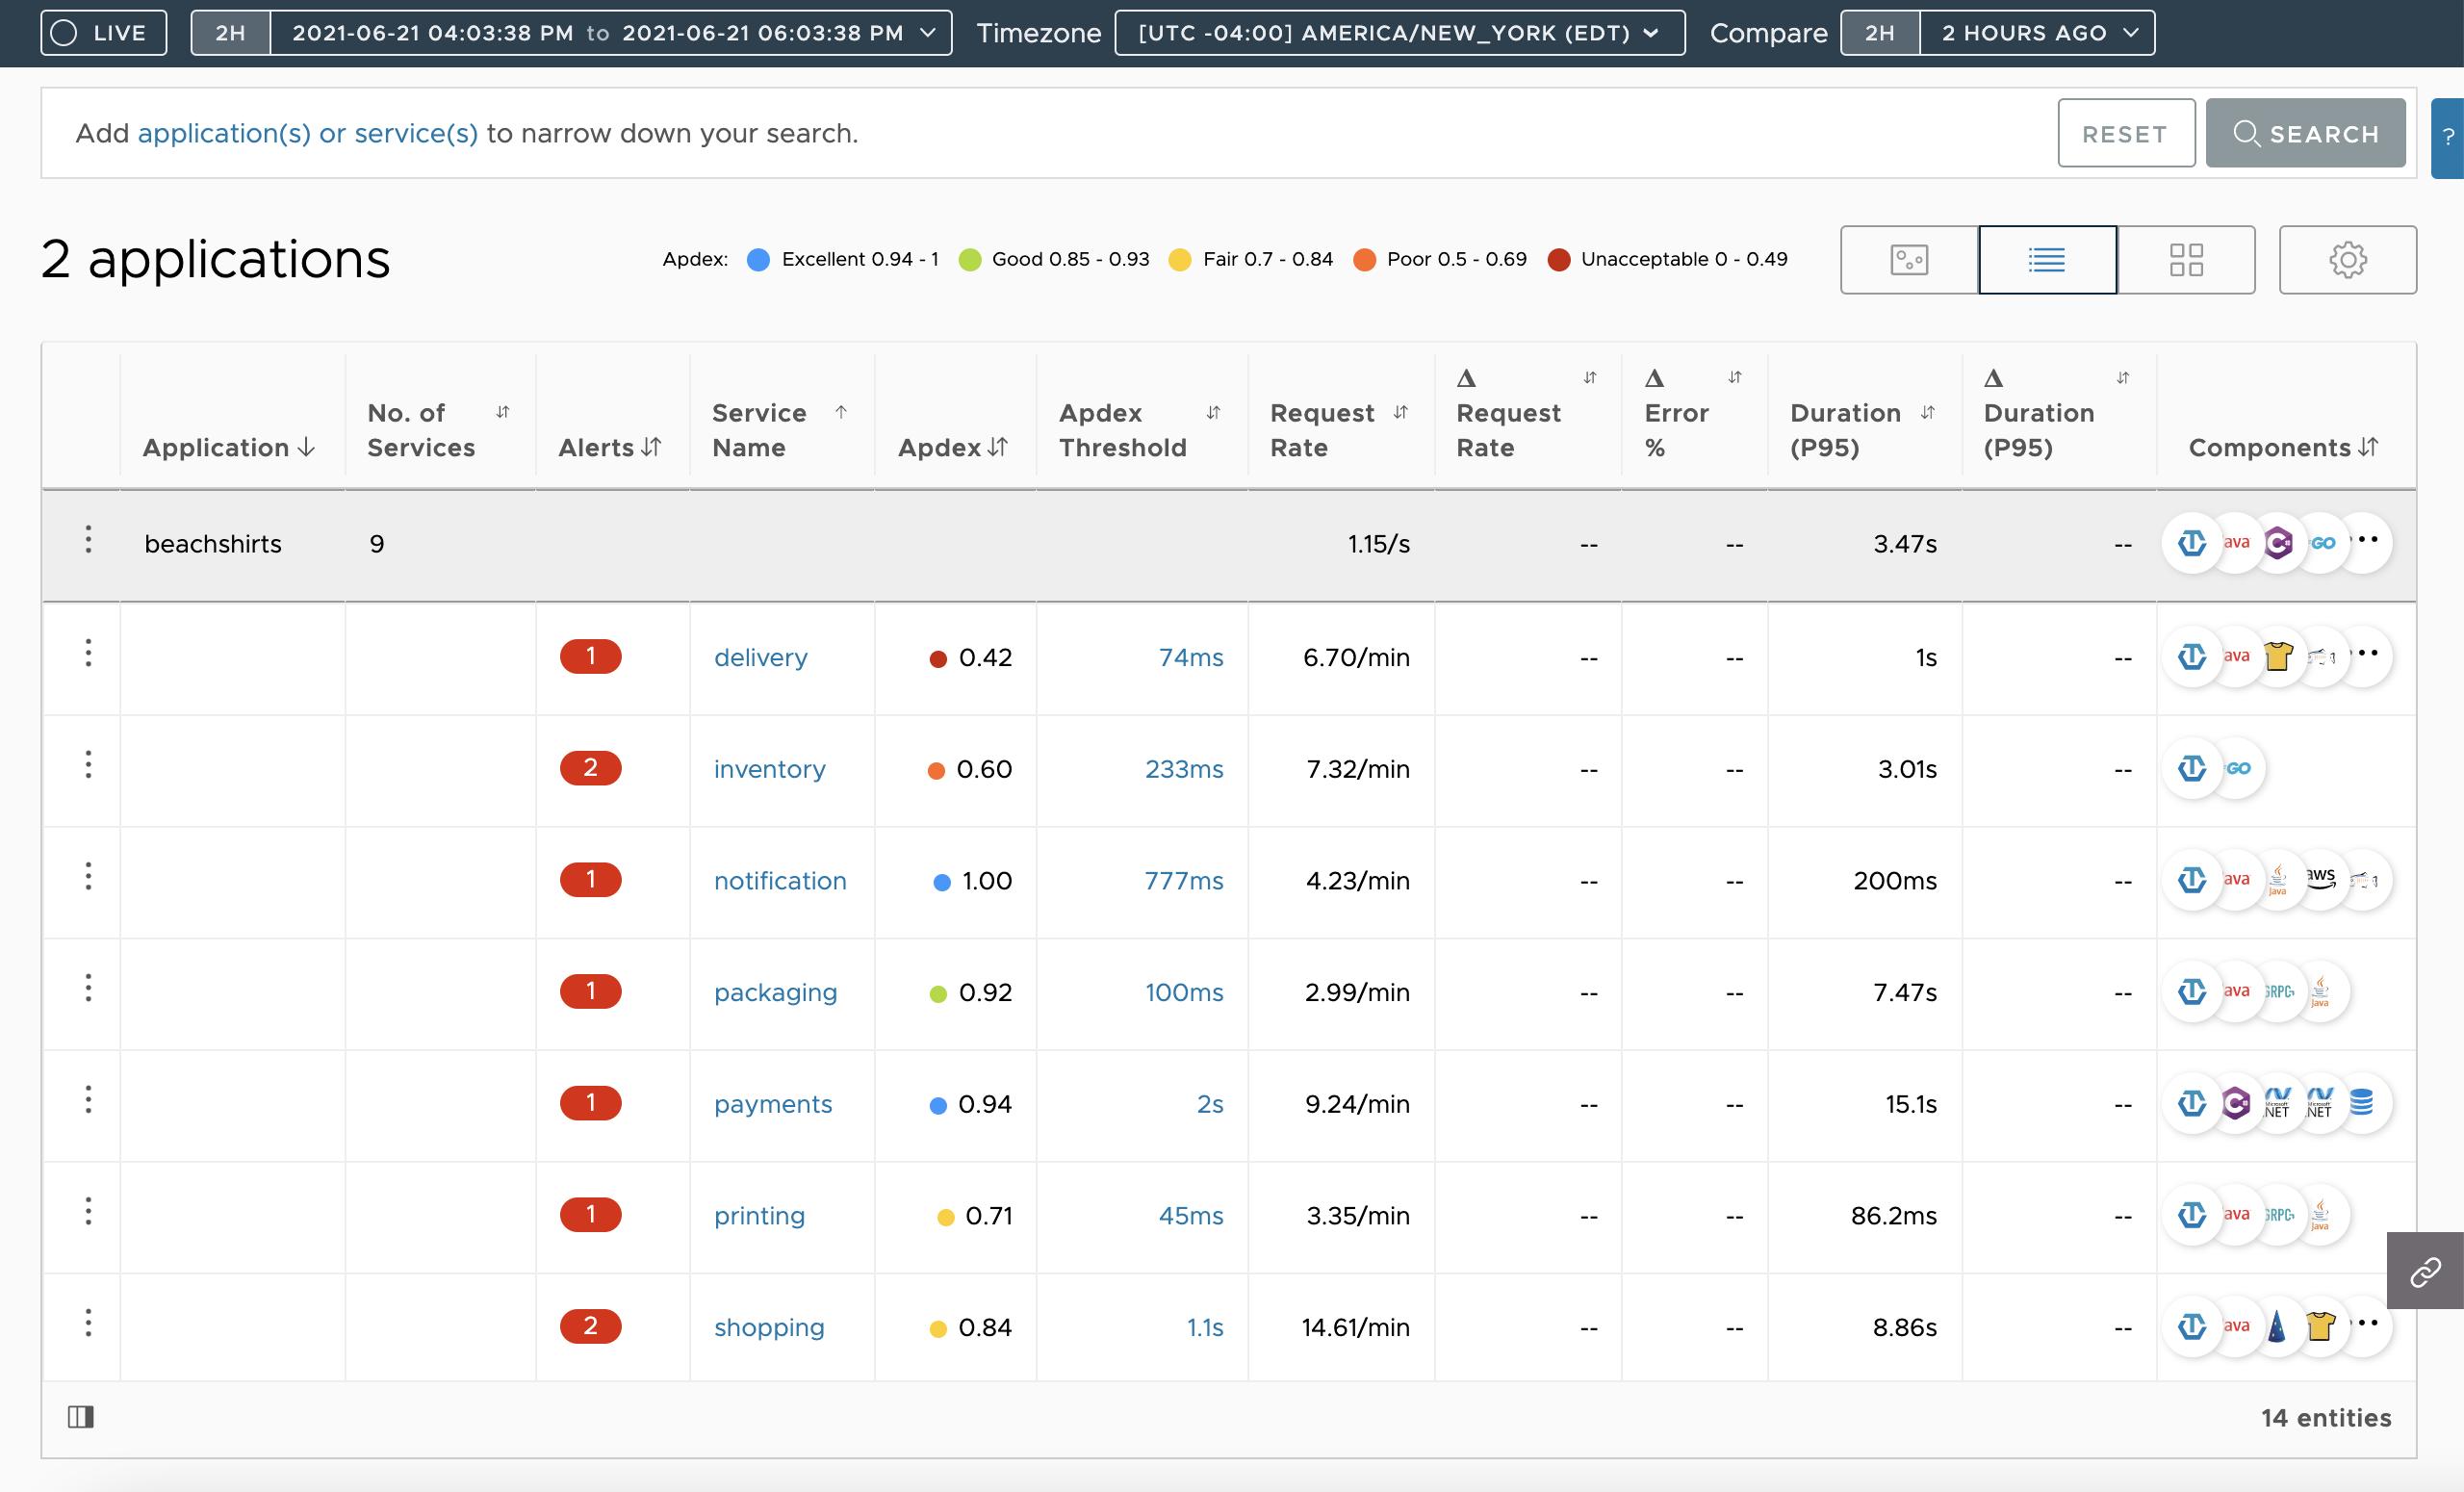
-
Table view lists the applications and services in the form of a table. You can see the Request, Error, and Duration (RED) metrics at a glance and sort the data.
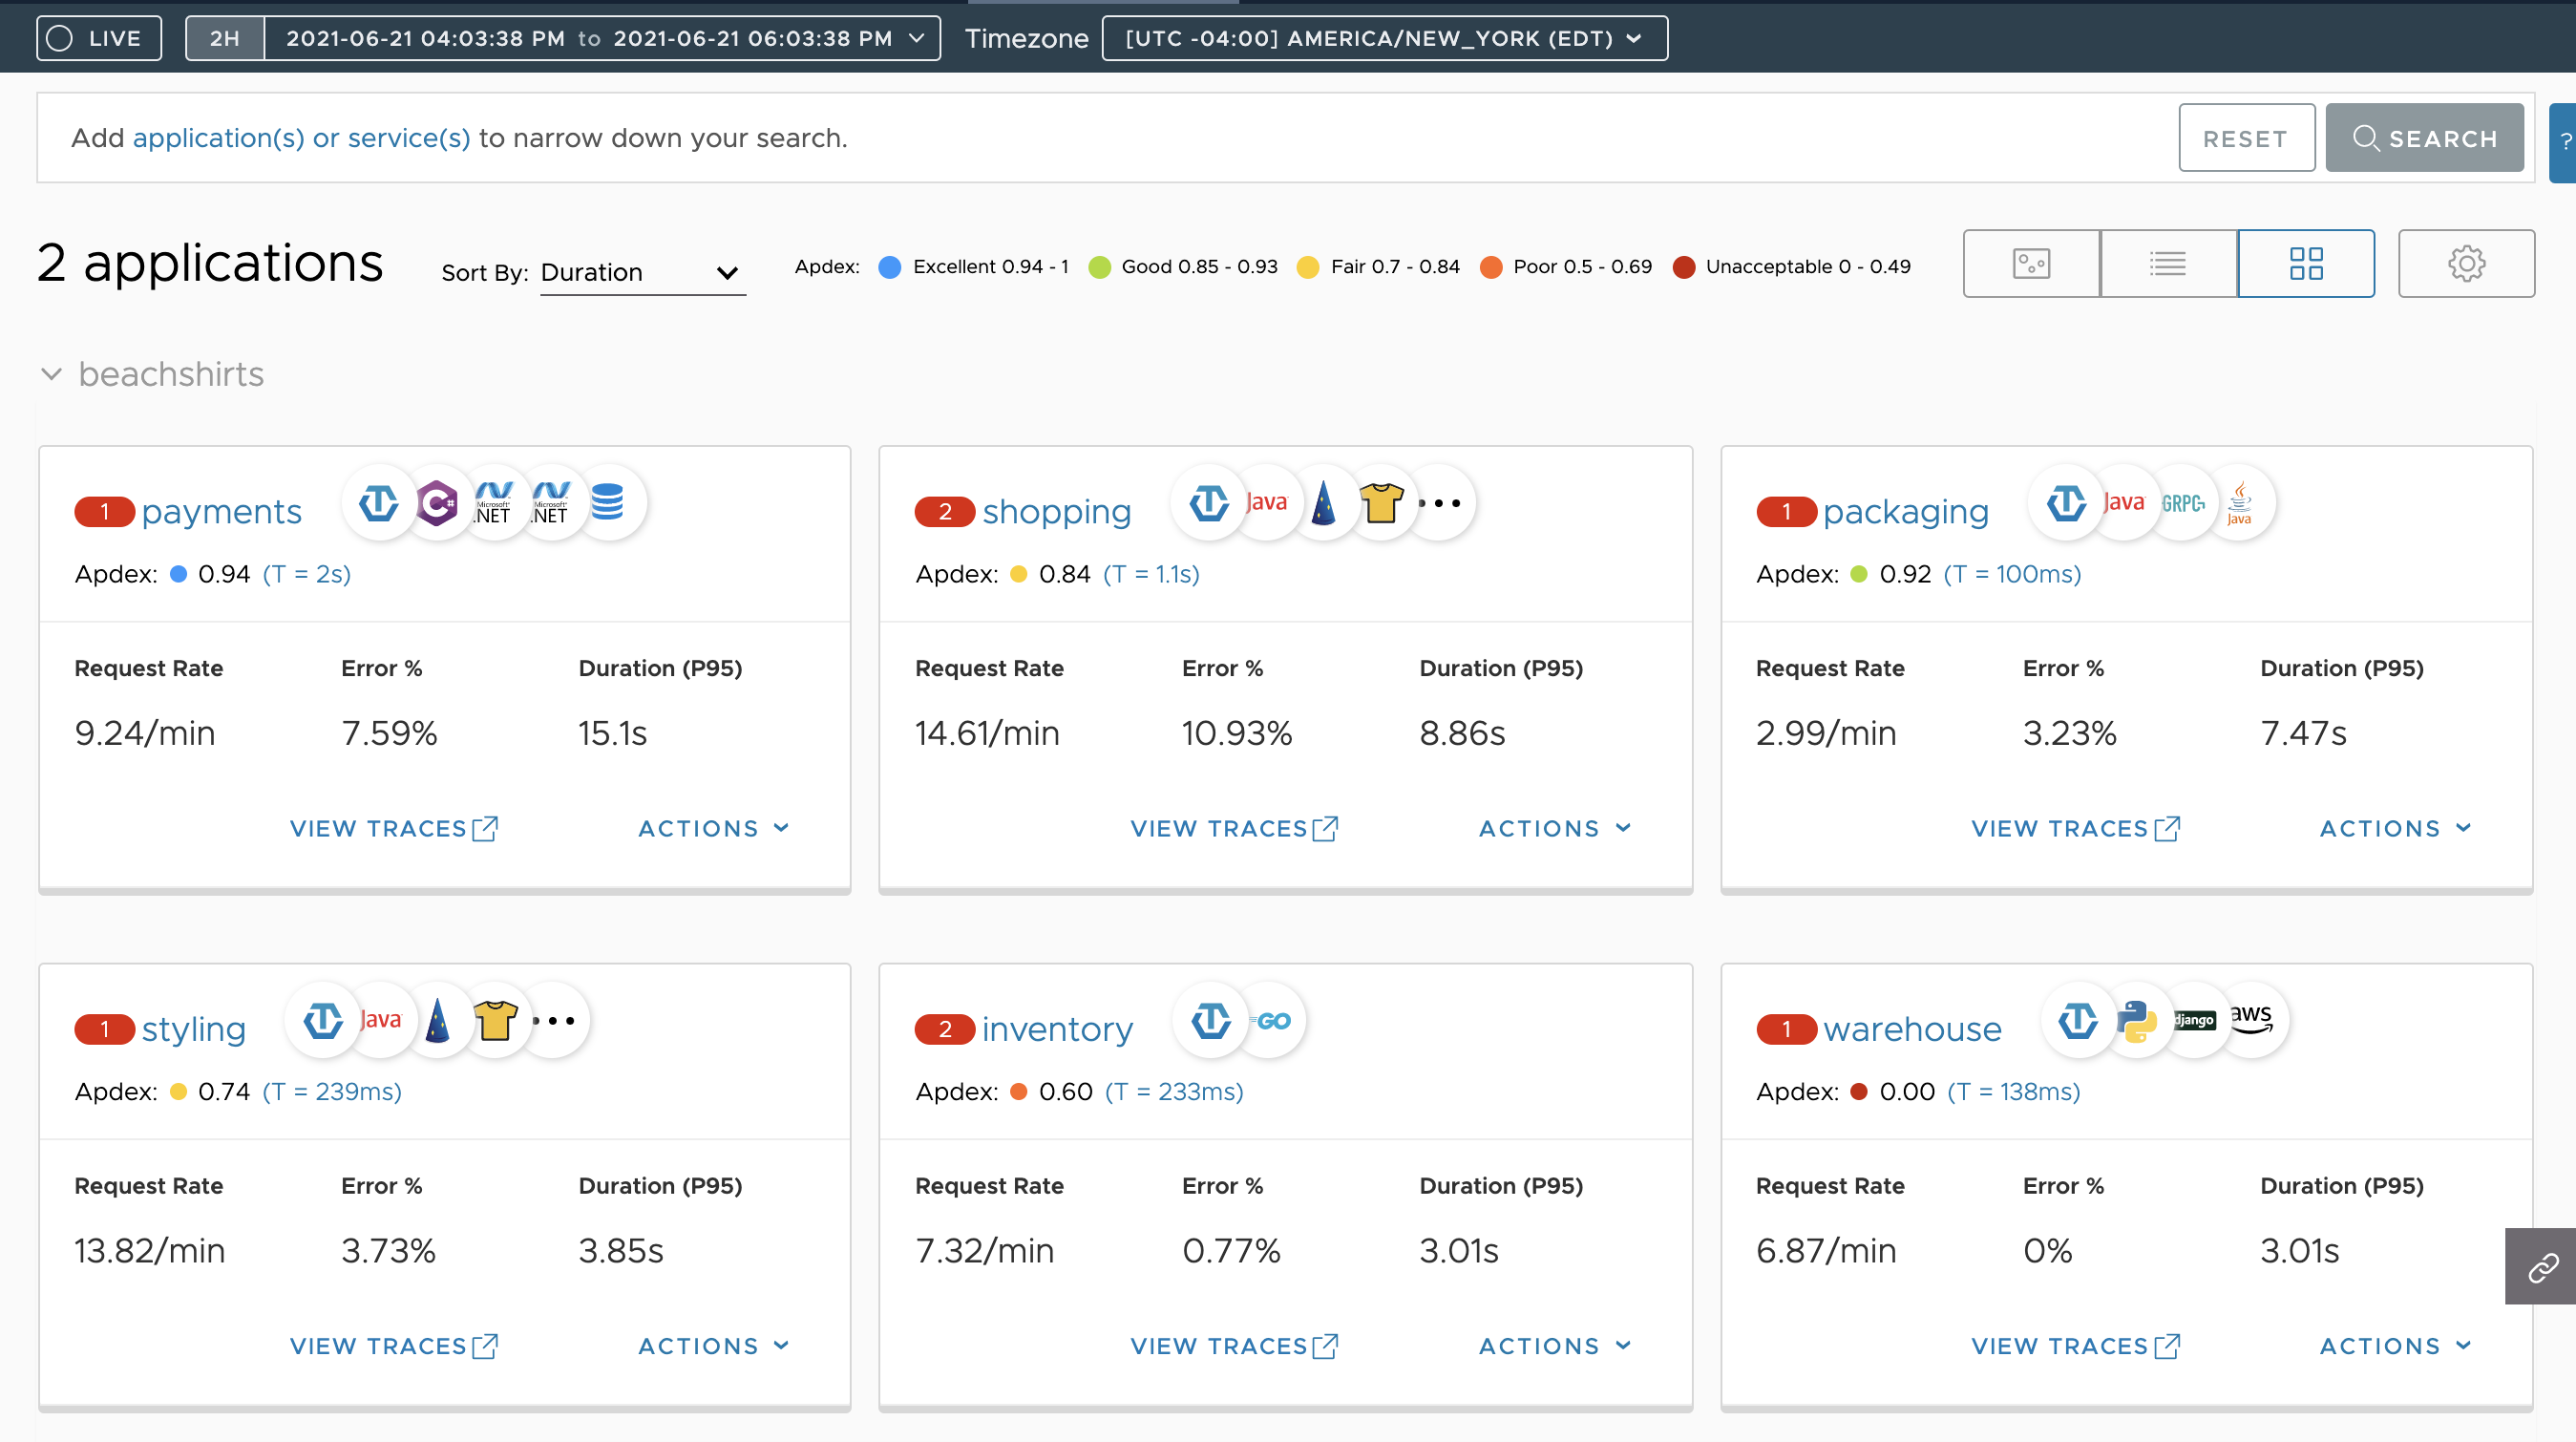
-
Grid view lists the application and services in a grid. You can see the RED metrics for each of the application’s services.
Examine Application RED Metrics Using Service Dashboard
The default, read-only dashboard for a service lets you explore trace data sent by each service in your application.

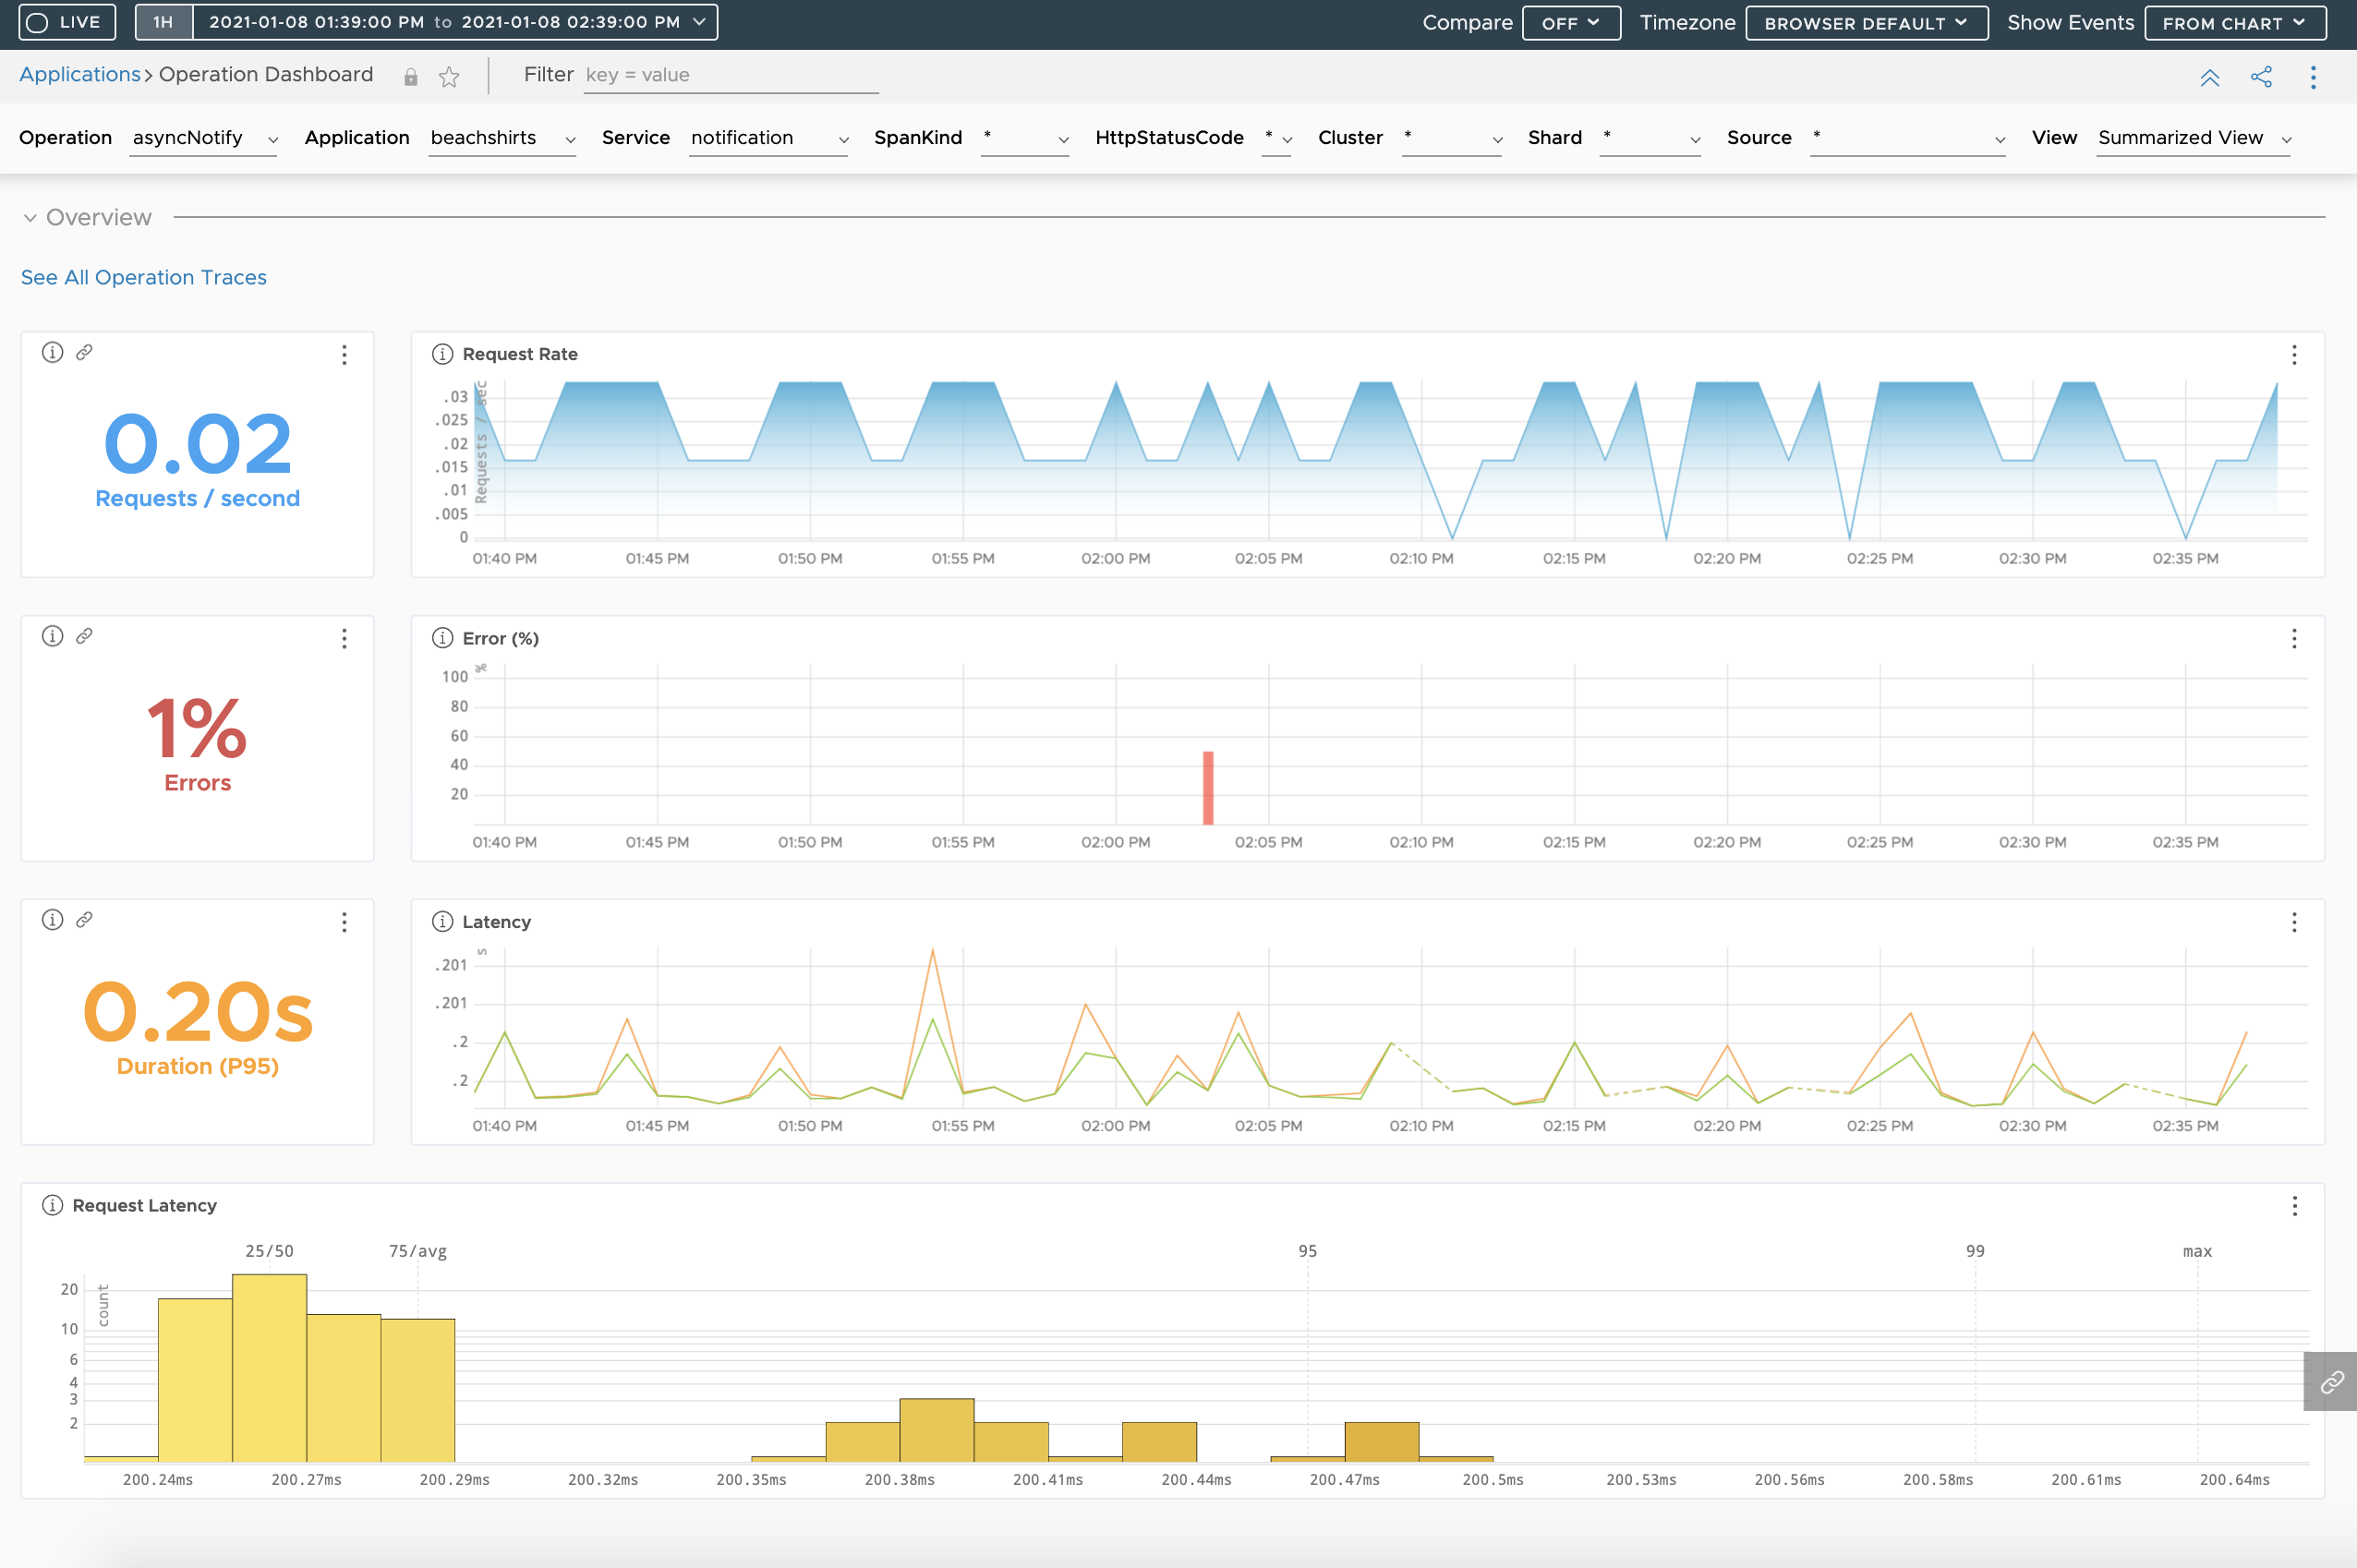
Examine Operation RED Metrics Using Operation Dashboard
The Operation Dashboard shows the RED metrics for each operation. You can view data for each operations using the filters and drill down to the traces browser.
Examine Traces Using Traces Browser
The Traces Browser supports a streamlined task flow for examining traces. You can perform trace queries, view query results, expand traces to see their member spans, and expand individual spans to see their details without having to navigate between pages and pop-ups.

Examine Downloaded Traces Using Offline Traces
You can export traces you view in the Traces Browser, save them locally as JSON files, and view them later using Offline Traces.

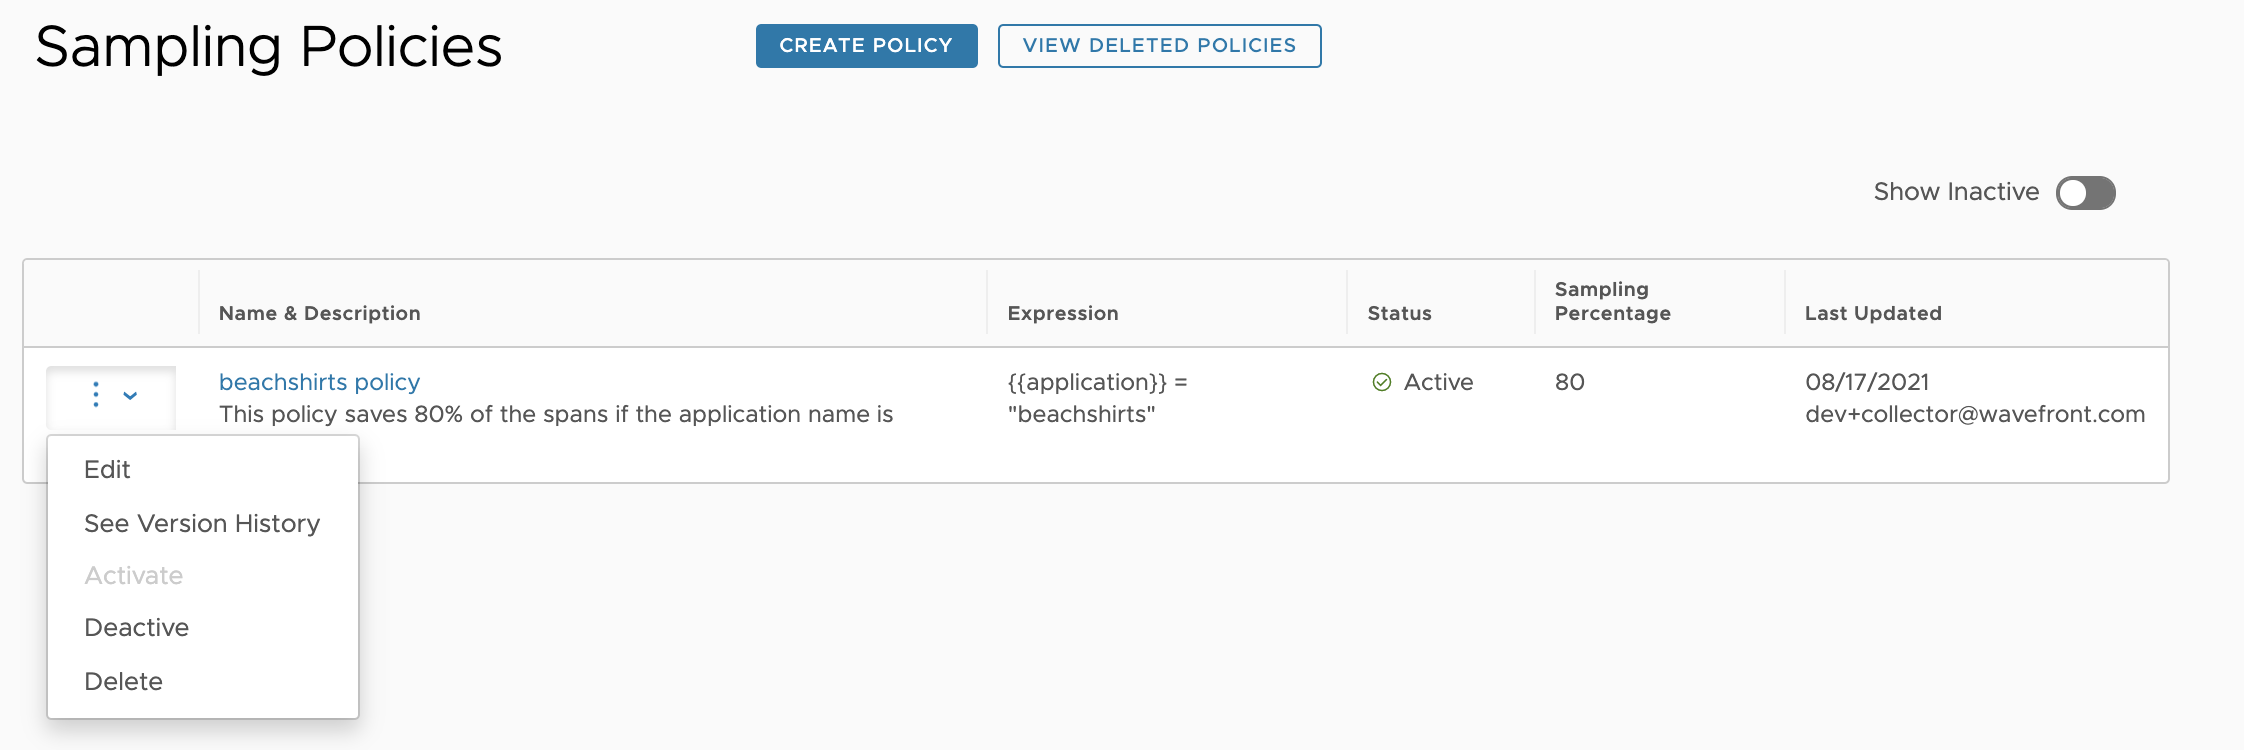
Create a Sampling Policy
Our intelligent sampling algorithm reduces the volume of ingested traces. The goals of intelligent sampling are to retain traces that are likely to be informative. But sometimes intelligent sampling discards traces that you want to keep. You can create a sampling policy to fine-tune intelligent sampling and let the Operations for Applications service know that you want to keep certain spans.
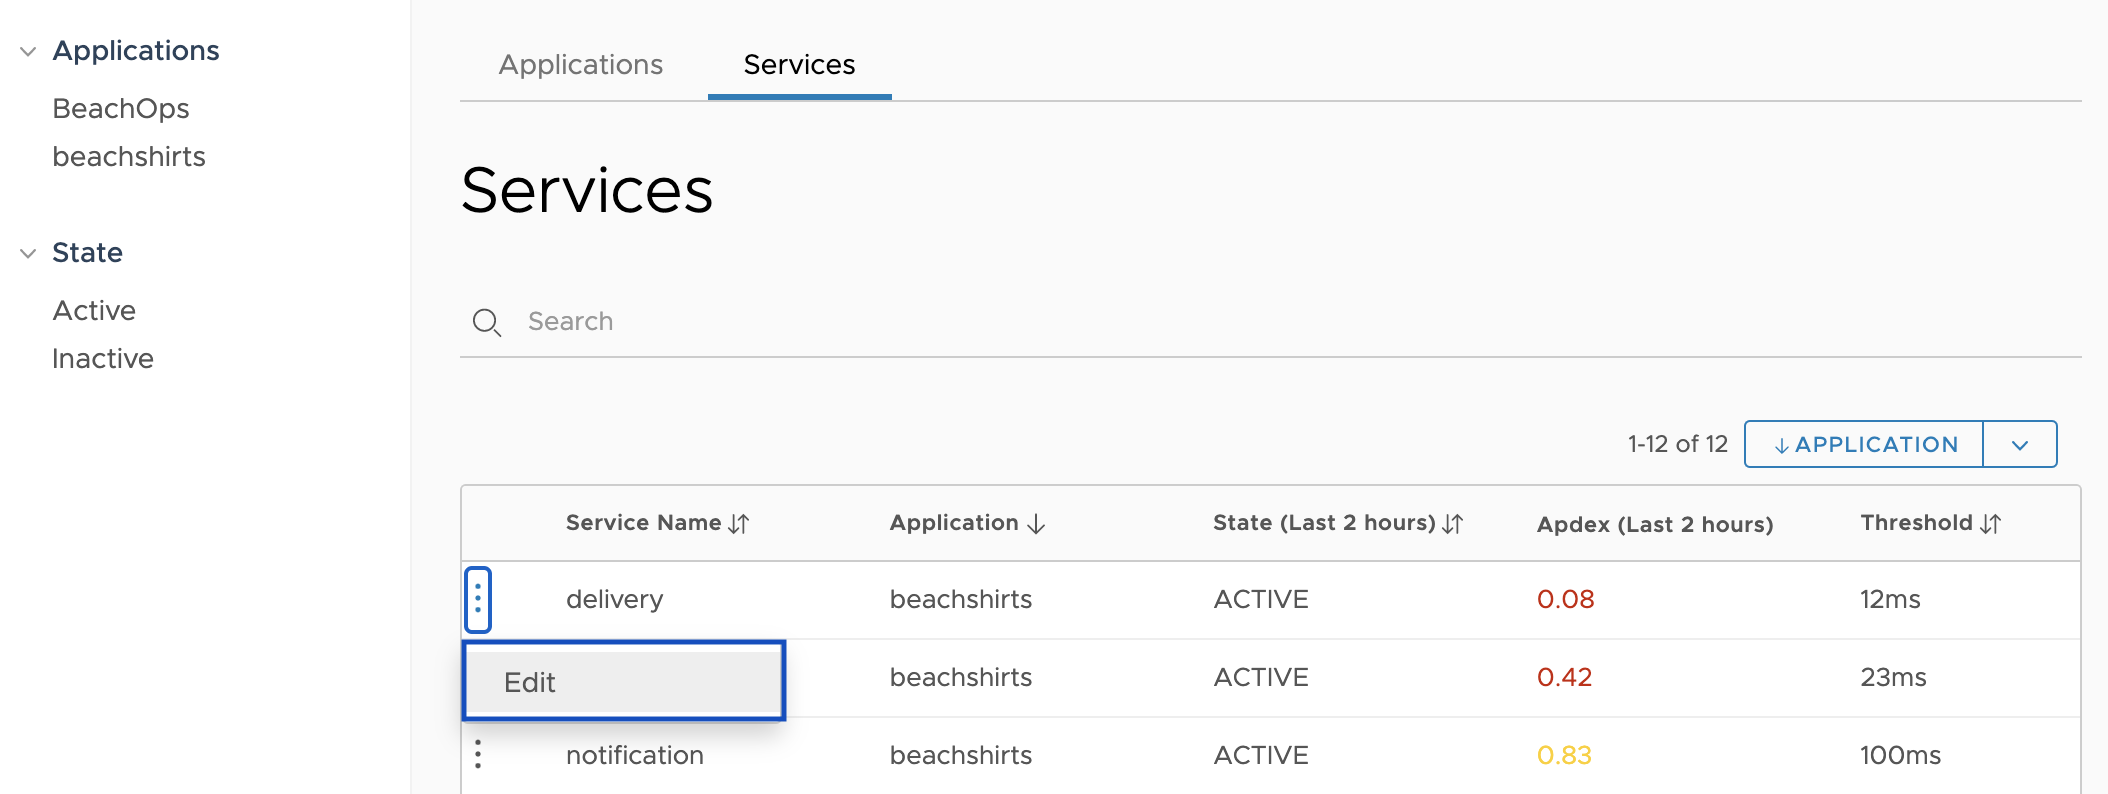
Configure Applications Using Application Configuration
The Apdex score helps you compare the response time of a service based on the response time threshold that you define. Define the response time threshold for each service using the Application Configuration page.
Next Steps
- Familiarize yourself with the tracing concepts. See Distributed Tracing Key Concepts for details.
- A large-scale web application can produce a high volume of traces. Many traces might be reported every minute, and each trace might consist of many spans, each with many tags. We limit the volume of trace data by performing intelligent sampling.