VMware Aria Operations for Applications (formerly known as Tanzu Observability by Wavefront) supports the roles, permissions, and groups authorization paradigm for managing global permissions. For example, a user with Dashboards permission can manage all dashboards. This paradigm is sufficient for many of our customers.
Super Admins or users with the Accounts permission who need finer-grained control can manage access on a per-object basis. We currently support access control for dashboards and alerts.
This video shows how to limit access for a dashboard, how to give access (share) that dashboard, and how to set the Security organization setting. You can manage access for alerts the same way. Note that this video was created in 2020, and some of the information in it might have changed. It also uses the 2020 version of the UI.
How Access Control Works
Operations for Applications supports granting and revoking access to dashboards and alerts.
- By default, all users can view all dashboards and alerts.
- Users with Dashboards permission can:
- Restrict or grant access to individual dashboards from the Dashboard browser.
- Click the Share icon on individual dashboards to change who has access.
- Users with Alerts permission can:
- Restrict or grant access for individual alerts from the Alerts browser.
- Click the Share icon on individual alerts to change who has access.
In high-security environments, administrators can change the security organization setting. After that change:
- Each new object (dashboard or alert) is visible only to the creator of the object and to the Super Admin users.
- The object creator or a Super Admin user can then share new dashboards with groups or users.
- If the administrator changes the Security organization setting back to allow Everyone access, then the objects that were created while the strict security organization setting was set, continue to be governed by access control.
Change Access for One or More Dashboards or Alerts
Privileged users can change the access setting for one or more dashboards or alerts from the Dashboards browser or the Alerts browser. The process is the same for both objects. The following steps show how to do it for dashboards.
- From the top menu bar, click Dashboards > All Dashboards.
- Select the check boxes for the dashboards you want to change. You can see the current Access settings in the Access column.
- Click +Access to add groups or users and -Access to remove groups or users.
- Enter the groups or users and click Update.
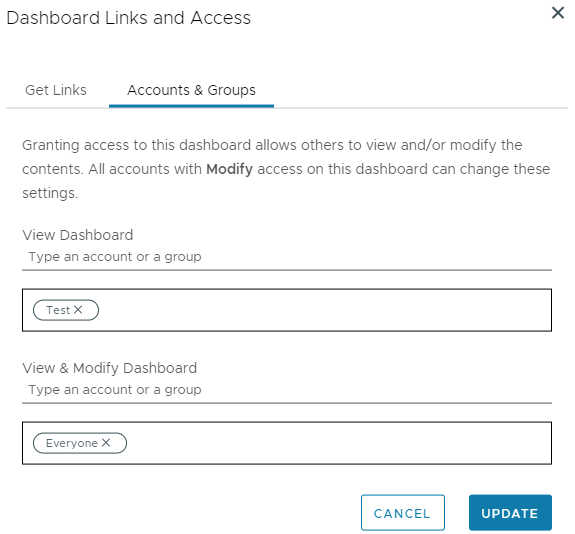
Changing Access for Individual Dashboards or Alerts
You can change access for an individual dashboard or alert from the Edit page of the object. For example, you can add access for the Finance group and revoke access for the Everyone group for a dashboard:
|
 |
Change the Access Control Security Organization Setting
Initially, all users can view all dashboards and alerts. In addition, global permissions apply:
- Users with Dashboards permission can modify all dashboards.
- Users with Alerts permission can modify all alerts.
As a user with the Accounts permissions or a Super Admin user, you can restrict access for new dashboards and alerts:
- From the gear icon on the toolbar, select Organization Settings.
- Click the Security tab and select Grant Modify Access To: Object Creator
After the change, access to new dashboards and new alerts is initially limited to the dashboard creator and the Super Admin users. Those users can share the objects with other groups or individual users by giving View access or View & Modify access.
By default, service accounts don’t have browse permissions. However, you can also grant access for new dashboards and alerts to service accounts:
- From the gear icon on the toolbar, select Organization Settings.
- Click the Security tab, select Grant Modify Access To: Everyone and Service Accounts.
Recovering an Inaccessible Dashboard or Alert
If you can no longer access a dashboard or alert, it was either deleted (moved to trash), it was permanently deleted, or the access settings for you or a group you belong to were changed.
- If a dashboard was deleted and moved to trash less than 30 days ago, a user with the Dashboards permission can restore the deleted dashboard.
- If an alert was deleted and moved to trash less than 30 days ago, a user with the Alerts permission can restore the deleted alert.
- If a dashboard was deleted and moved to trash more than 30 days ago, or was permanently deleted, and no one, including the Super Admin, can find the dashboard, the Super Admin can attempt to restore the dashboard by using the API.
- If the access settings to a dashboard or alert have changed, you can ask a Super Admin or a user with the Accounts permissions to restore the access for you.
- If all users and groups can no longer access a specific dashboard or alert, a Super Admin may need to check if it is in an orphaned state. A Super Admin user can make orphan dashboards and alerts visible.
Only a Super Admin user, can restore dashboard permissions and attempt to restore a permanently deleted dashboard.
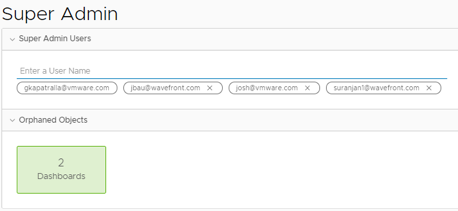
Make Orphan Dashboards or Alerts Visible
An orphan dashboard results if:
- All users and groups, including the Everyone group, no longer have access.
- Only one user had access to a dashboard or an alert, and that user was deleted.
To restore an orphan dashboard or alert:
- Log in as a Super Admin user and enable Super Admin mode.
- From the gear icon on the toolbar, select Super Admin.
- Select the orphaned dashboard or alert and share it with other users or groups.
Recover a Permanently Deleted Dashboard
A permanently deleted dashboard does not show in the trash and becomes inaccessible to all users, including the Super Admin. As a Super Admin, you can try to restore the dashboard by using the REST API.
- Log in as a Super Admin user and enable Super Admin mode.
- From the gear icon on the toolbar, select API Documentation.
- Expand the Dashboard category and click the
GET api/v2/dashboard/{id}/history/{version}request. - Enter the dashboard name as the
"id"parameter. For example, if the dashboard URL ishttps://<your_instance>.wavefront.com/dashboards/MY-DASHBOARD, then the"id"that you should enter is MY-DASHBOARD. -
Enter the last known version of the dashboard as an integer.
If you don’t know the version, you can enter 1. This way, you also determine whether the dashboard
"id"input has ever existed. -
Click Execute.
If the dashboard
"id"and the dashboard version don’t exist, the API call returns an error like:{ "status": { "result":"ERROR", "message":"dashboard does not exist", "code":404 } } -
Copy the Response body of the request, that starts after
"response":up to and including the last but one closing curly bracket (}).{ "modifyAclAccess":true, "hidden":false, "parameters":{}, "name":"MY DASHBOARD", "id":"MY-DASHBOARD", ... "favorite":false, "numCharts":2 } - Click the
POST api/v2/dashboard/request. -
Paste the copied response data into the Edit Value text box and click Execute to perform the POST API call.
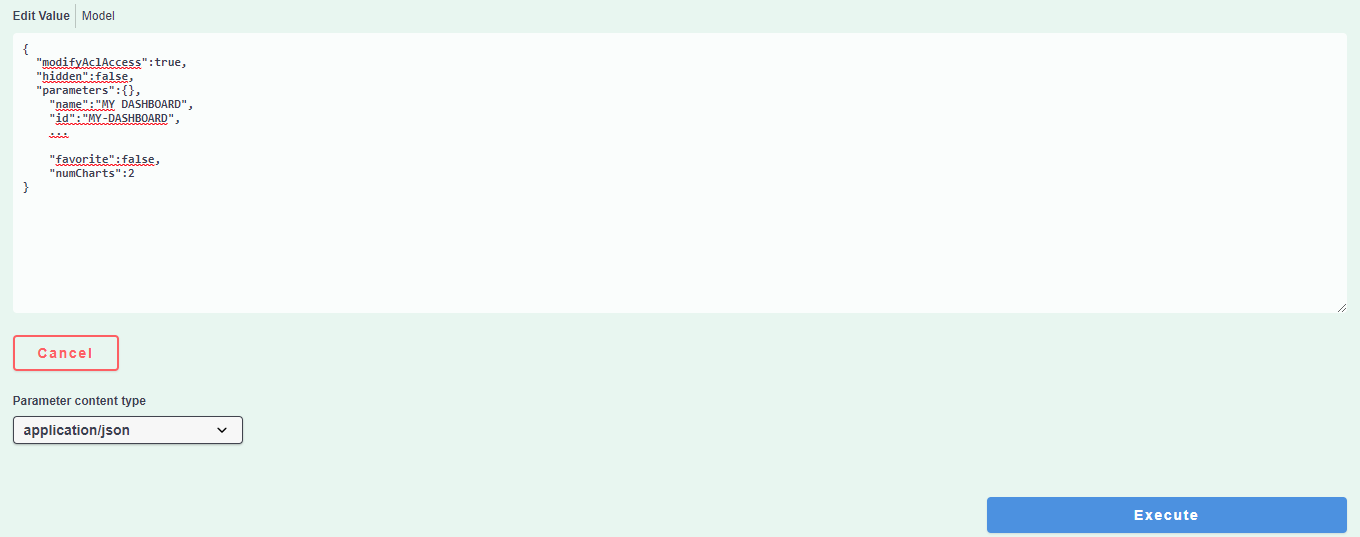
This will restore the dashboard.
-
Validate that the dashboard is now live again.
For example, navigate to
https://<your_instance>.wavefront.com/dashboards/MY-DASHBOARD/historyand you should now be able to review the dashboard history by using the GUI.