VMware Aria Operations for Applications (formerly known as Tanzu Observability by Wavefront) supports several types of metrics, including 2 kinds of counters.
- Cumulative counters (usually called counters in this doc set) monotonically increasing counters. They’re useful for aggregating metric information such as the number of hits on a web page, how many users log into a portal, etc. They’re usually used with
rate()or a similar function. - Delta counters (sometimes called periodic counters) measure the change since a metric was last recorded. For example, metrics for request count could be delta counters. Each value records how many requests were received since the last data point was recorded.
Video
Learn the difference between cumulative counters and delta counters and see how to manage delta counters from the UI. Note that this video was created in 2020 and some of the information in it might have changed. It also uses the 2020 version of the UI.
Counters and Delta Counters Basics
It often makes sense to collect both counter metrics and delta counter metrics – though in some serverless environments only delta counters are available. You use a different function for the different types of counters.
| Type | Description | Function |
|---|---|---|
| Cumulative counter | Counters that increase in value over time, for example, the total number of errors or bytes received. | ts() |
| Delta counter | Delta counters bin to a minute timestamp and treat writes to the same bin as deltas. Accurately accumulate points when shorts bursts of high-volume traffic is experienced and collisions can become a problem. | cs() |
Example
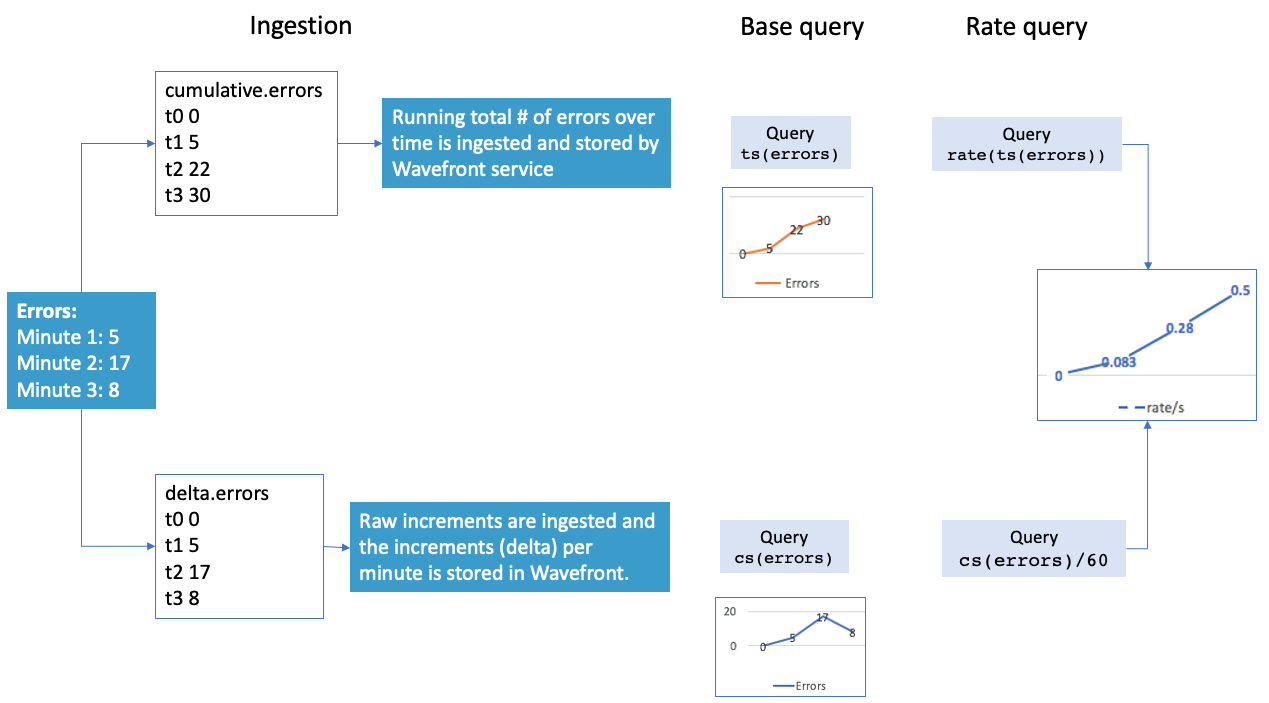
The following illustration contrasts cumulative counters and delta counters with a simple example:
- Error data are being sent to Operations for Applications. 5 errors in the first minute, 17 in the second, and 8 in the third.
- The top row shows cumulative counter behavior. In many cases, the data actually come in as cumulative counters:
- The running total of the errors (5, 22, 30) is ingested and stored.
- The
ts()query shows a chart with values increasing over time. - To get the rate (errors per second) we wrap the query with
rate()
- The bottom row shows delta counter behavior.
- The delta for the errors is ingested. In addition, all errors for 1 minutes are binned (not shown here).
- The
cs()query shows a chart with the delta values. - To get the rate (errors per second) we divide the query by 60. The result is the same as using
rate()with thets()query.
Where Are Cumulative Counters Useful?
Counters show information over time and are useful for aggregating metrics information. Counter metrics usually increase over time but might reset back to zero, for example, when a service or system restarts. Users can wrap rate() around a counter if they want to ignore temporary 0 values.
Where Are Delta Counters Useful?
Users who are monitoring an environment where multiple sources perform the same function can’t use cumulative counters. Lost points because of collision are likely. We solve the problem by performing the aggregation on the server side. Delta counters are therefore especially suitable for serverless Function-as-a-service environments and some other use cases.
Delta counters are useful if you want to combine points that come in at the same time from several sources. For example:
- You’re monitoring a Function-as-a-Service (FaaS or serverless) environment, and many functions execute simultaneously. It’s not possible to monitor bursty traffic like that without losing some reported metric points due to collision.
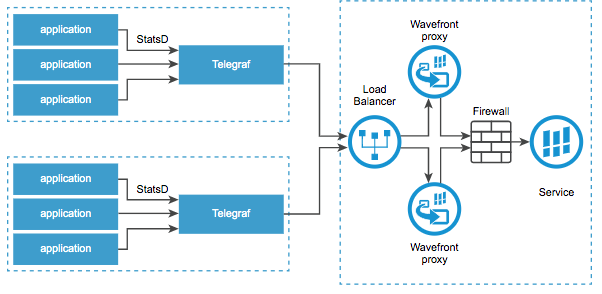
- You want to collect metrics from two sets of applications, each using a separate Telegraf instance behind a load balancer.
- You want to aggregate counters across multiple apps. For example, the logs to metrics integration uses delta counters.
For more on delta counter use cases, see the blog Monitoring Apps in the Serverless World: Introducing Delta Counters
Example: Monitoring AWS Lambda with Delta Counters
AWS Lambda allows you to specify functions that you want to run – and then you can stop worrying about the function execution. For example, assume that you want to generate a thumbnail each time any of your users uploads images to a folder. You can write a Lambda function that monitors the folders and takes care of thumbnail generation for you. AWS runs as many of the functions as necessary to handle the current workload, and you don’t have to worry about scaling up or down.
Delta counters make monitoring easy for this use case. Operations for Applications aggregates the metrics that come from different invocations of the same function. The AWS Lambda Functions integration comes preconfigured with several delta counters and a gauge for standard metrics. In addition, you can monitor custom business metrics by using our SDK to define a wrapper for your AWS Lambda function. See the AWS Lambda Functions Integration for setup instructions.
Using Delta Counters
You have to send and query delta counters like this:
To send metrics as delta counters explicitly specify a delta character as the first letter of the metric name.
To query delta counter metrics
|
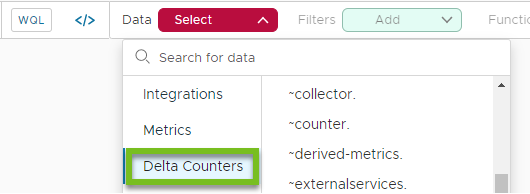 |
| To examine all delta counters in your environment, select Browse > Delta Counters. The process is the same as examining metrics in the Metrics Browser. | 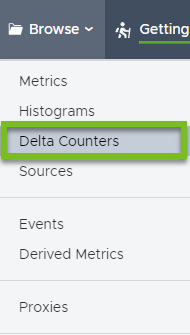 |
The cs() Function
If you use the cs() function (instead of the ts() function) with a query, the query engine treats the incoming data as delta counters:
- Bin to a minute timestamp
- Treat write operations to the same bin as deltas.
SDKs and Examples
You can use our SDKs to make your metric a delta counter.
SDKs
- Java - Dropwizard Metrics SDK
- Java - Spring Micrometer
- C# - App Metrics Reporter
- Python - wavefront-pyformance
- Go - go-metrics-wavefront
Examples
- AWS Lambda SDKs - These AWS Lambda wrappers illustrate how to use delta counters:
- Python Client - For an example of using delta counters without an integration, see the delta.py file, which is part of the wavefront-pyformance module.
Delta Counter Proxy Configuration Properties
We support the following proxy configuration properties with delta counters.
- deltaCounterPorts: Comma-separated list of ports that accept only delta counter data.
- deltaCounterAggregationInterval: Time that the proxy spends aggregating data before sending them to Operations for Applications. Default is 30 seconds.
Delta Prefix
If you want to send metrics as delta counters to the Wavefront proxy or directly to Operations for Applications, prefix each metric with a delta (∆) character, as shown in the following sample code snippet.
DELTA_PREFIX = u"\u2206"
ALT_DELTA_PREFIX = u"\u0394"
∆aws.lambda.wf.invocations.count as cs(aws.lambda.wf.invocations.count).Using Cumulative Counters
Cumulative counters are for incrementally increasing values such as the number of bytes received.
Counter Example (Count Total)
In most cases, you can get the information you need from a counter as follows:
- A counter usually represents something like “how many requests have been processed” or “how many errors happened”. You get the metric like this:
ts(~sample.network.bytes.received) - You use the
rate()function to get the corresponding per-second rate so you know, for example, “how many requests have been processed per second?” or “How many errors are happening per second”:rate(ts(~sample.network.bytes.received)) - There are often multiple time series that have the counter (e.g. coming from different sources). Each time series reports the count of the requests received or errors. If you’re interested in the total count across your system, you can use
sum()to sum it up into a single time series.sum(rate(ts(~sample.network.bytes.received)))
Counter Example (Count Total Over Time Period)
If you want to count the total number of occurrences of a certain time period, the syntax is slightly more complex. Because counters commonly reset to zero, you need a query that counts the total number of increments over the time period you’re looking at. You want to ignore any counter resets.
Here, we want to get the number of errors for 1 day.
- We start by wrapping the counter with
ratediff(), which, in contrast torate()returns the absolute difference between incrementing data points without dividing by the number of seconds between them.ratediff(ts(the.counter)) - We use
alignto group the data values of the time series into buckets 1 minute.align(1m, sum, ratediff(ts(the.counter))) - We use
rawsum()to combine all time series into one series, and to not use interpolation.rawsum(align(1m, sum, ratediff(ts(the.counter)))) - Finally, we get the result for 1 day by using the
msum()function.msum(1d, rawsum(align(1m, sum, ratediff(ts(the.counter)))))
Gauge into Counter
To turn a gauge into a counter, you can use query language functions such as integral. For example, you could convert a ~alert.checking_frequency.My_ID to see the trend in checking frequency instead of the raw data.
integral(ts(~alert.checking_frequency.My_ID))