This page provides an overview of what you can do with the VMware Tanzu Application Service integration. The documentation pages only for a limited number of integrations contain the setup steps and instructions. If you do not see the setup steps here, navigate to the Operations for Applications GUI. The detailed instructions for setting up and configuring all integrations, including the VMware Tanzu Application Service integration are on the Setup tab of the integration.
- Log in to your Operations for Applications instance.
- Click Integrations on the toolbar, search for and click the VMware Tanzu Application Service tile.
- Click the Setup tab and you will see the most recent and up-to-date instructions.
Tanzu Application Service Integration
Tanzu Application Service is a popular platform for building cloud-native applications. This integration uses the VMware Tanzu Observability by Wavefront Nozzle v4. The integration offers TAS data egress, system dashboards, and alerts. A TAS environment with many foundations can be difficult to debug. Tanzu Observability can help. With an easy setup, TAS specific SLIs, ability to monitor across your foundations and out-of-the-box dashboards and alerts, you’ll be up and running in no time.
Supported Versions: TAS v2.11 and later.
Benefits
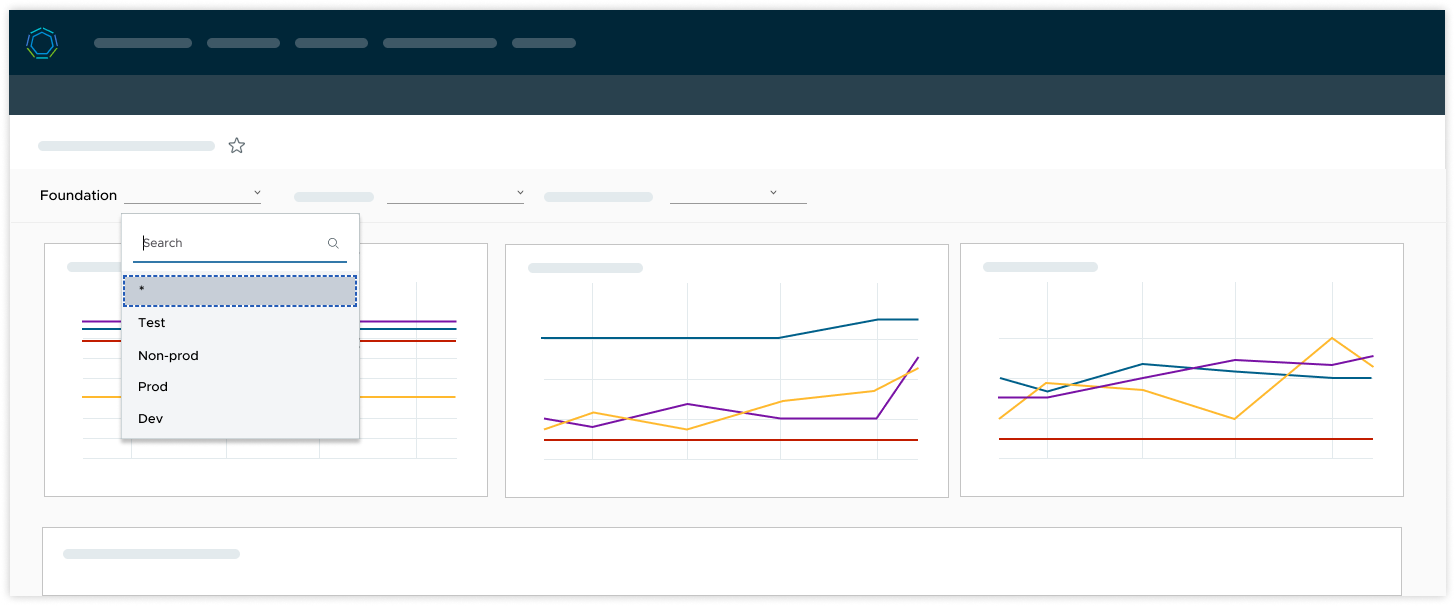
- Multi-foundation capabilities: Explore the data from all your foundations by using dashboard variables.
- Opinionated monitoring: Collection of critical metrics that allow you to monitor and visualize the health of Tanzu Application Service (TAS).
- PPS management: Customize the nozzle in Ops Manager, for example update the scrape interval.
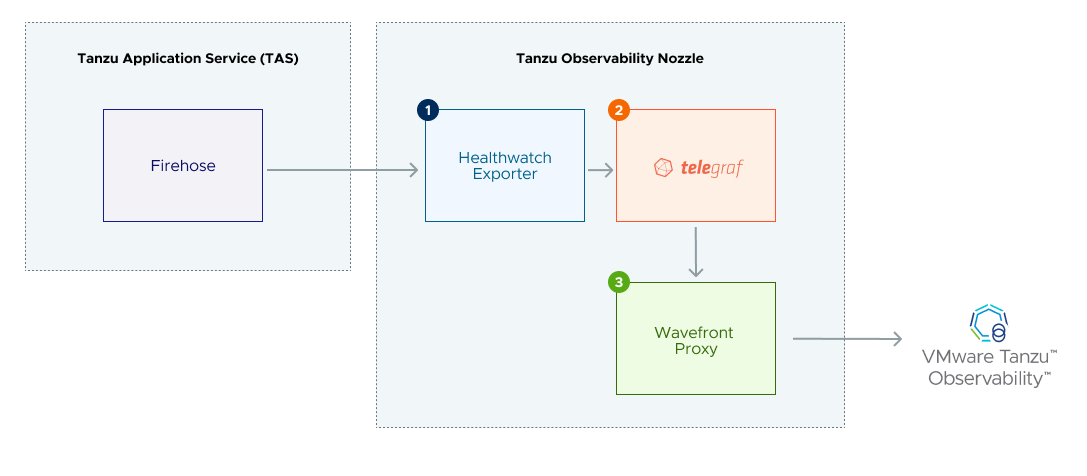
How It Works
The Tanzu Observability Nozzle for TAS has three major components.
- The Healthwatch exporters are VMs that stream metrics from the TAS Firehose.
- Telegraf scrapes these metrics, converts them to Wavefront data format, and streams them to the Wavefront proxy.
- The Wavefront proxy sends the metrics to the Wavefront service.
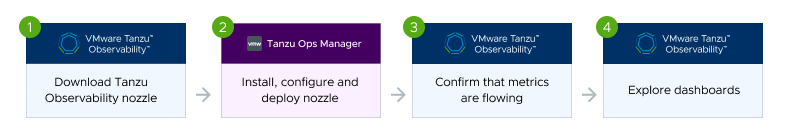
Step 1: Download the Tanzu Observability Nozzle Tile
The Tanzu Observability Nozzle is the code that sends data from Tanzu Application Service to Operations for Applications.
Step 2: Upload, Configure, and Deploy the Nozzle Tile in Ops Manager
- Log in to Ops Manager.
- Upload the TAS Integration for Tanzu Observability.
- Configure the nozzle. At a minimum, specify the following:
- Wavefront Proxy Configuration:
- Wavefront instance URL
- Authentication Configuration
- User-friendly host name
- Telegraf Agent Configuration:
- Foundation name
- Wavefront Proxy Configuration:
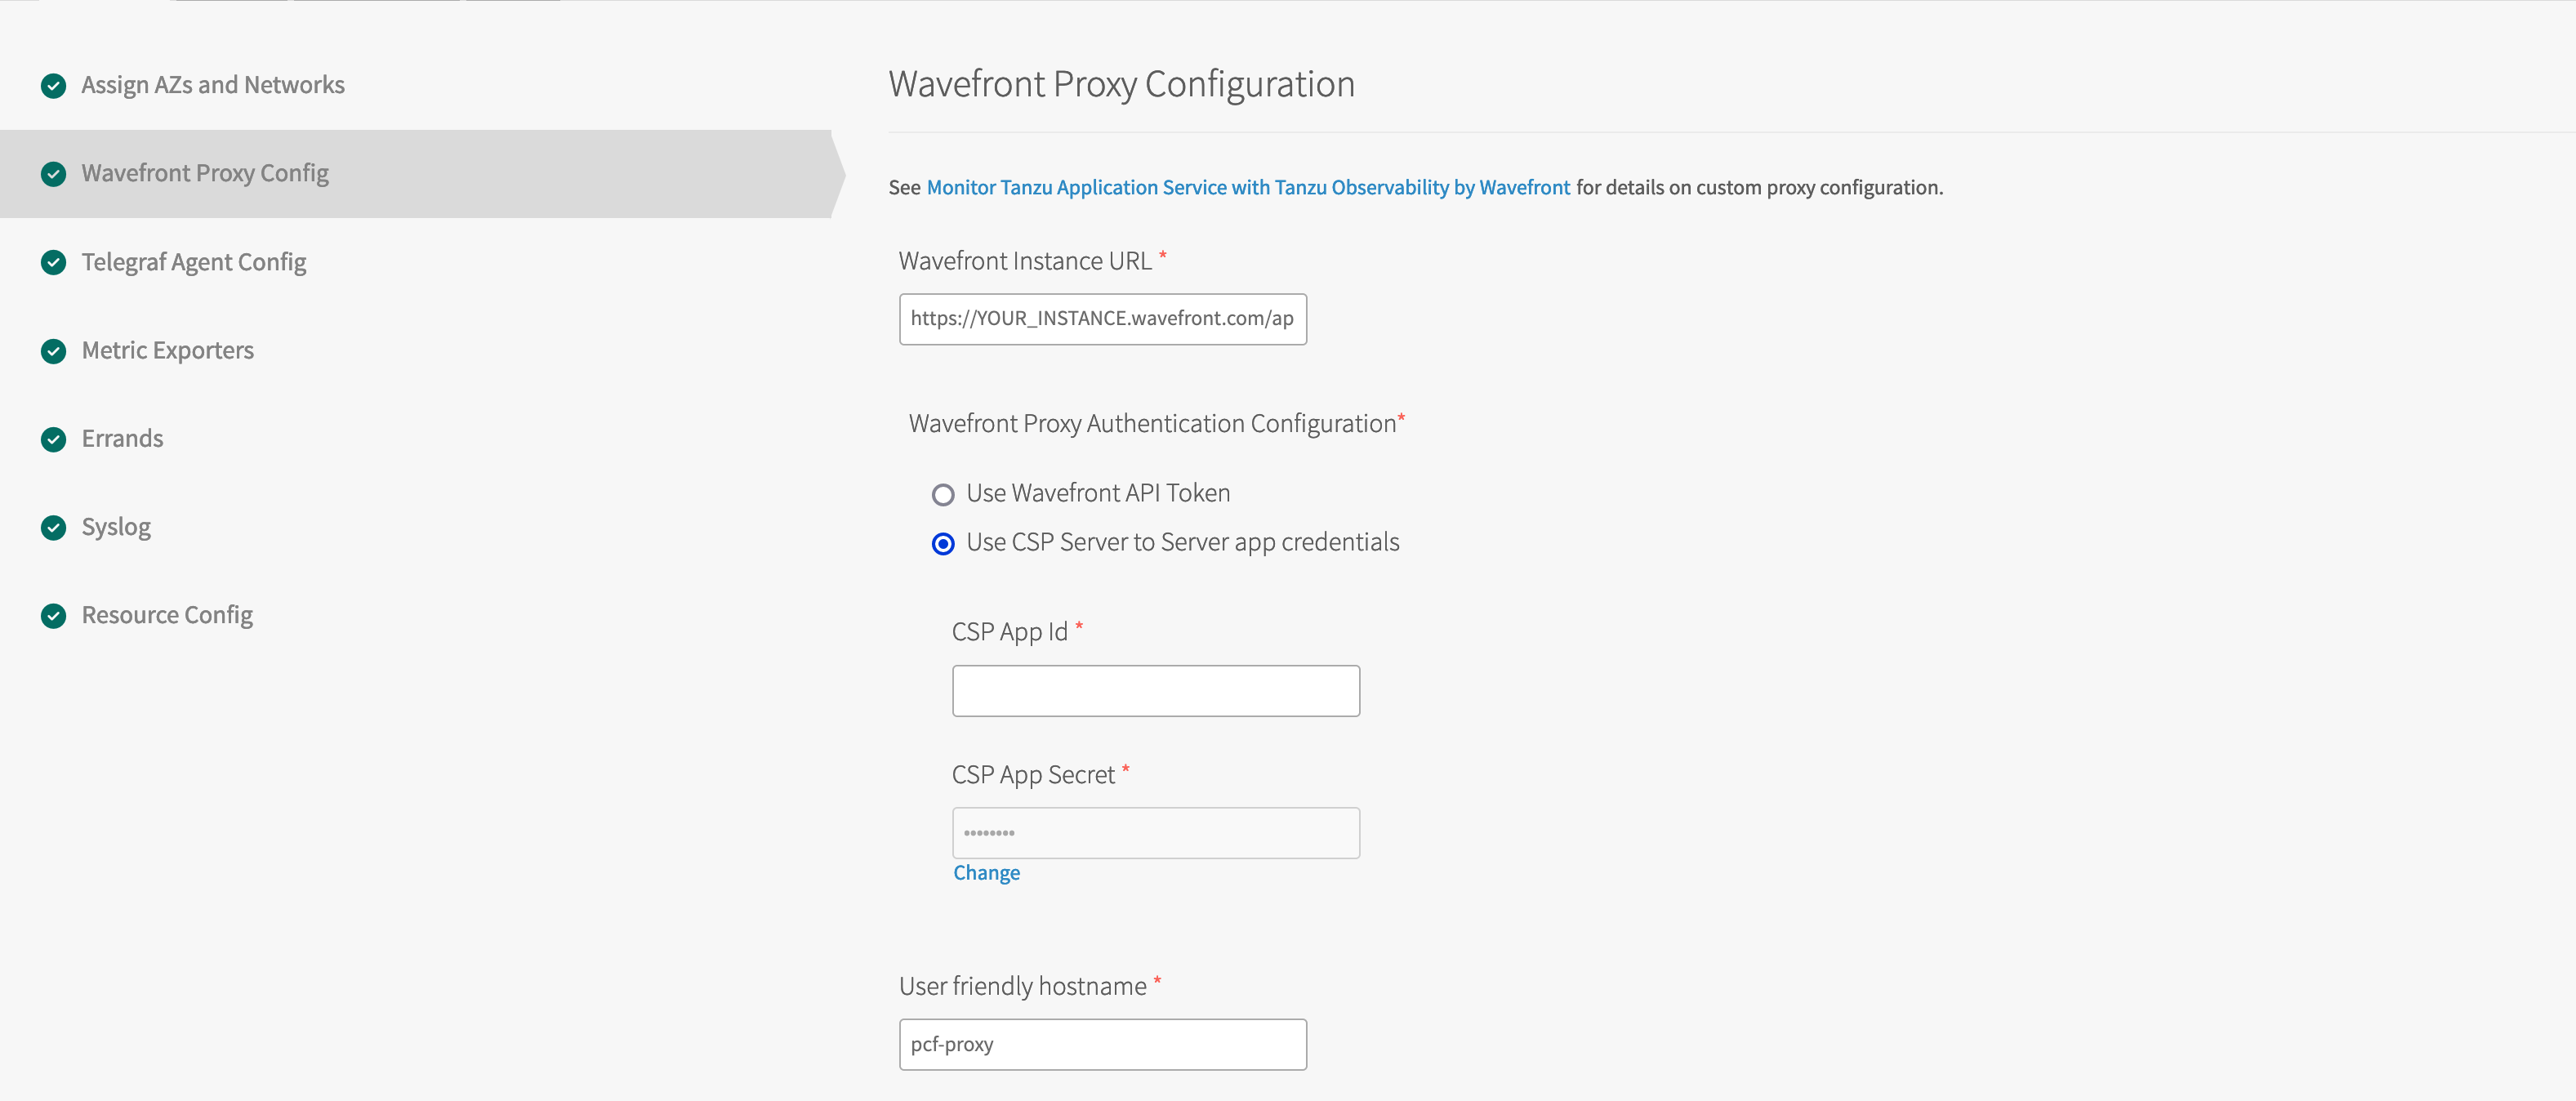
Authentication Configuration
Use a valid Tanzu Observability API token.
See the documentation for details and FAQs.
Step 3: Confirm that Metrics are Flowing
After the tile is deployed in Ops Manager, metrics are sent to Tanzu Observability. To confirm, click the Metrics tab.
Step 4: Explore TAS Metrics with the System Dashboards
Examine your foundation data with the out-of-the-box dashboards on the Dashboards tab.
Tanzu Application Service Metrics Overview
This page describes the most important metrics exposed by the Tanzu Application Service (TAS) integration. This list of metrics is not comprehensive. The full list of unique metrics varies from environment to environment based on factors such as the TAS version, the optional packages installed, and the custom application metrics.
The Key Performance Indicators listed below are the most important metrics for the TAS platform. These are the metrics that you should monitor to track the overall platform health.
Key Performance Indicators
For more details about the metrics listed below, see Key Performance Indicators.
| Metric Name | Description |
|---|---|
| tas.auctioneer.AuctioneerFetchStatesDuration | Time in ns that the Auctioneer took to fetch state from all the Diego Cells when running its auction. |
| tas.auctioneer.AuctioneerLRPAuctionsFailed | The number of Long Running Process (LRP) instances that the Auctioneer failed to place on Diego Cells. |
| tas.auctioneer.AuctioneerLRPAuctionsStarted | The number of LRP instances that the Auctioneer successfully placed on Diego Cells. |
| tas.auctioneer.AuctioneerTaskAuctionsFailed | The number of Tasks that the Auctioneer failed to place on Diego Cells. |
| tas.auctioneer.LockHeld | Indicates whether an Auctioneer instance holds the expected Auctioneer lock (in Locket). 1 means the active Auctioneer holds the lock, 0 means the lock was lost. |
| tas.bbs.BBSMasterElected | Indicates when there is a BBS master election. A BBS master election takes place when a BBS instance has taken over as the active instance. A value of 1 is emitted when the election takes place. |
| tas.bbs.ConvergenceLRPDuration | Time in ns that the BBS took to run its LRP convergence pass. |
| tas.bbs.CrashedActualLRPs | Total number of LRP instances that have crashed. |
| tas.bbs.Domain_cf_apps | Indicates if the cf-apps Domain is up-to-date, meaning that the TAS for VMs app requests from the Cloud Controller are synchronized to bbs.LRPsDesired (Diego-desired AIs) for execution. |
| tas.bbs.LockHeld | Indicates whether a BBS instance holds the expected BBS lock (in Locket). 1 means the active BBS server holds the lock, 0 means the lock was lost. |
| tas.bbs.LRPsExtra | Total number of LRP instances that are no longer desired but still have a BBS record. When Diego wants to add more apps, the BBS sends a request to the Auctioneer to spin up additional LRPs. LRPsExtra is the total number of LRP instances that are no longer desired but still have a BBS record. |
| tas.bbs.LRPsMissing | Total number of LRP instances that are desired but have no record in the BBS. |
| tas.bbs.LRPsRunning | The total number of LRP instances that are running on Diego Cells. |
| tas.capi.info | Exposes the TAS version as tags. |
| tas.capi.servicedbindings | Exposes information about services and bound apps as tags. |
| tas.bbs.RequestLatency | The maximum observed latency time over the past 60 seconds that the BBS took to handle requests across all its API endpoints. |
| tas.gorouter.backend_exhausted_conns | The lifetime number of requests that have been rejected by the Gorouter VM due to the Max Connections Per Backend limit being reached across all tried back ends. |
| tas.gorouter.bad_gateways | The lifetime number of bad gateways, or 502 responses, from the Gorouter itself, emitted per Gorouter instance. |
| tas.gorouter.file_descriptors | The number of file descriptors currently used by the Gorouter job. |
| tas.gorouter.latency | The time in milliseconds that represents the length of a request from the Gorouter’s point of view. |
| tas.gorouter.latency_uaa | Time in milliseconds that UAA took to process a request that the Gorouter sent to UAA endpoints. |
| tas.gorouter.ms_since_last_registry_update | Time in milliseconds since the last route register was received, emitted per Gorouter instance. |
| tas.gorouter.responses_5xx | The lifetime number of requests completed by the Gorouter VM for HTTP status family 5xx, server errors, emitted per Gorouter instance. |
| tas.gorouter.total_requests | The lifetime number of requests completed by the Gorouter VM, emitted per Gorouter instance. |
| tas.gorouter.total_routes | The current total number of routes registered with the Gorouter, emitted per Gorouter instance. |
| tas.locket.ActiveLocks | Total count of how many locks the system components are holding. |
| tas.locket.ActivePresences | Total count of active presences. Presences are defined as the registration records that the Diego Cells maintain to advertise themselves to the platform. |
| tas.p-mysql._mysql_available | Indicates whether the MySQL service is available and responding to requests. |
| tas.p-mysql._mysql_galera_wsrep_cluster_size | The number of cluster nodes with which each node is communicating normally. |
| tas.p-mysql._mysql_galera_wsrep_cluster_status | Shows the primary status of the cluster component that the node is in. |
| tas.p-mysql._mysql_galera_wsrep_ready | Shows whether each cluster node can accept queries. Returns only 0 or 1. |
| tas.p-mysql._mysql_net_max_used_connections | Shows the maximum used number of connections over the maximum permitted number of simultaneous client connections. |
| tas.p-mysql._mysql_performance_cpu_utilization_percent | CPU time being consumed by the MySQL service. |
| tas.p-mysql._mysql_performance_queries_delta | The number of statements executed by the server over the last 30 seconds. |
| tas.p-mysql._mysql_system_ephemeral_disk_used_percent | The percentage of disk used on the ephemeral file system. |
| tas.p-mysql._mysql_system_persistent_disk_used_percent | The percentage of disk used on the persistent file system. |
| tas.p-mysql._mysql_variables_max_connections | Shows the maximum used number of connections over the maximum permitted number of simultaneous client connections. |
| tas.rep.CapacityRemainingDisk | Remaining amount of disk in MiB available for this Diego Cell to allocate to containers. |
| tas.rep.CapacityRemainingMemory | Remaining amount of memory in MiB available for this Diego Cell to allocate to containers. |
| tas.rep.GardenHealthCheckFailed | The Diego Cell periodically checks its health against the Garden backend. For Diego Cells, 0 means healthy and 1 means unhealthy. |
| tas.rep.RepBulkSyncDuration | Time in ns that the Diego Cell Rep took to sync the ActualLRPs that it claimed with its actual Garden containers. |
| tas.route_emitter.RouteEmitterSyncDuration | Time in ns that the active Route Emitter took to perform its synchronization pass. |
| tas.bosh-system-metrics-forwarder.system_cpu_user | CPU utilization - The percentage of CPU spent in user processes. |
| tas.bosh-system-metrics-forwarder.system_disk_ephemeral_percent | Ephemeral disk - Percentage of the ephemeral disk used on the VM. |
| tas.bosh-system-metrics-forwarder.system_disk_persistent_percent | Persistent disk — Percentage of persistent disk used on the VM. |
| tas.bosh-system-metrics-forwarder.system_disk_system_percent | System disk — Percentage of the system disk used on the VM. |
| tas.bosh-system-metrics-forwarder.system_healthy | 1 means the system is healthy and 0 means the system is not healthy. |
| tas.bosh-system-metrics-forwarder.system_mem_percent | System Memory — Percentage of memory used on the VM. |
| tas.uaa.requests_global_completed_count | The lifetime number of requests completed by the UAA VM, emitted per UAA instance. This number includes health checks. |
| tas.uaa.server_inflight_count | The number of requests UAA is currently processing (in-flight requests), emitted per UAA instance. |
Alerts
- TAS Apps Manager Availability:A result code of a poll to the Apps Manager URL. A result code of zero indicates a successful poll. See here for details.
- TAS Auctioneer Fetch State Duration Taking Too Long:Time that the Auctioneer took to fetch state from all the Diego Cells when running its auction. See here for details.
- TAS Auctioneer LRP Auctions Failed:The number of Long Running Process (LRP) instances that the Auctioneer failed to place on Diego Cells. See here for details.
- TAS Auctioneer Task Auctions Failed:The number of Tasks that the Auctioneer failed to place on Diego Cells. See here for details.
- TAS BBS Fewer App Instances Than Expected:Total number of LRP instances that are desired but have no record in the BBS. See here for details.
- TAS BBS More App Instances Than Expected:Total number of LRP instances that are no longer desired but still have a BBS record. See here for details.
- TAS BBS Time to Handle Requests:The maximum observed latency time over the past 60 seconds that the BBS took to handle requests across all its API endpoints. See here for details.
- TAS BBS Time to Run LRP Convergence:Time that the BBS took to run its LRP convergence pass. See here for details.
- TAS BOSH Director Health:The total number of times the BOSH health SLI test suite has failed. See here for details.
- TAS BOSH VM Disk Used:Percentage of the system disk used on the VM. See here for details.
- TAS BOSH VM Ephemeral Disk Used:Percentage of the ephemeral disk used on the VM. See here for details.
- TAS BOSH VM Persistent Disk Used:Percentage of the persistent disk used on the VM. See here for details.
- TAS CLI Command Status:The total number of times the App SLI Smoke Test Suite has failed. See here for details.
- TAS Certificate Expiration:The number of seconds until expiration of each certificate in the foundation. See here for details.
- TAS Cloud Controller and Diego Not in Sync:Indicates if the cf-apps Domain is up-to-date, meaning that TAS app requests from Cloud Controller are synchronized to tas.bbs.LRPsDesired (Diego-desired AIs) for execution. See here for details.
- TAS Diego Cell Container Capacity:Percentage of remaining container capacity for a given Diego cell. See here for details.
- TAS Diego Cell Memory Chunks Available:Indicates the available Diego Cell memory, by number of available full chunks for a given deployment. See here for details.
- TAS Diego Cell Replication Bulk Sync Duration:Time that the Diego Cell Rep took to sync the ActualLRPs that it claimed with its actual garden containers. See here for details.
- TAS Diego Cell Route Emitter Sync Duration:Time the active Route Emitter took to perform its synchronization pass. See here for details.
- TAS Garden Health Check Failed:The Diego Cell periodically checks its health against the Garden back end. For Diego Cells, 0 means healthy, and 1 means unhealthy. See here for details.
- TAS Gorouter File Descriptors:The number of file descriptors currently used by the Gorouter job. See here for details.
- TAS Gorouter High CPU Utilization:The Gorouter is experiencing average CPU utilization above 65% (warn) or 70% (severe). See here for details.
- TAS Gorouter Time Since Last Route Register Received:Time since the last route register was received, emitted per Gorouter instance. Indicates if routes are not being registered to apps correctly. See here for details.
- TAS Gorouter VM Health:Measures the state of the processes running on the Gorouter VM. See here for details.
- TAS Locks Held by Auctioneer:Whether an Auctioneer instance holds the expected Auctioneer lock (in Locket). See here for details.
- TAS Locks Held by BBS:Whether a BBS instance holds the expected BBS lock (in Locket). See here for details.
- TAS Low Proxy Points Received:Measures the total PPS received by the Wavefront proxy. See here for details.
- TAS MySQL Status:This alert uses the metric from the SQL database used by system components, not from the MySQL service used by applications. See here for details.
- TAS Ops Manager Availability:A result code of a poll to the Ops Manager URL. A result code of zero indicates a successful poll. See here for details.
- TAS Percentage of Diego Cells with Enough Disk to Stage Apps:Percentage of Diego Cells with at least one chunk of Disk space available to stage an application. See here for details.
- TAS Telegraf Gatherer and Exporter Scrape Errors:Increase in number of errors during scraping in the last 5 minutes. See here for details.
- TAS UAA Latency is Elevated:Time in milliseconds that UAA took to process a request that the Gorouter sent to UAA endpoints. See here for details.
- TAS UAA VM Health:Measures the state of the processes running on the UAA VM. See here for details.