VMware Aria Operations for Applications (formerly known as Tanzu Observability by Wavefront) derives RED metrics for spans that have the application, service, cluster, shard, component, or operationName span tags by default. See Indexed and Unindexed Span Tags for details. If you want to filter RED metrics data using a span tag that is not a default span tag, you need to propagate it as a custom span tag to the RED metrics.
The following custom span tags are supported by default.
| Custom span tag | Description |
|---|---|
span.kind |
Filter spans based on the span type. The default value is none.
Example: client for a client-side span and server for a server-side span. |
http.status_code |
Filter spans based on the error code. Example: 404 or 500 |
Follow the steps given below to propagate custom span tags when sending data from your application. Once the data is ingested, you can use queries to create custom dashboards that help you filter and view the information you need. Let’s look at a sample scenario that adds a custom span tag where you can compare the data in the production and staging environments.
-
Create a custom span-level tag. Assume you have a span that has the
env=span tag.Note:When adding custom span-level tags, make sure that it is of low cardinality:
- Do not have more than 50 custom span tags.
- Do not have more than 100 values assigned to a span tag.
If you are using OpenTelemetry, you send data to Operations for Applications using Wavefront proxy. Add the configuration shown below to the
<wavefront_config_path>/wavefront.conffile. See Paths to find out where the file is saved.traceDerivedCustomTagKeys=envIf you are using Jaeger, you send data to Operations for Applications using Wavefront proxy. Add the configuration shown below to the
<wavefront_config_path>/wavefront.conffile. See Paths to find out where the file is saved.traceDerivedCustomTagKeys=envIf you are using Zipkin, you send data to Operations for Applications using Wavefront proxy. Add the configuration shown below to the
<wavefront_config_path>/wavefront.conffile. See Paths to find out where the file is saved.traceDerivedCustomTagKeys=envIf your application uses Spring Boot 2, add the configuration shown below to your application's
application.propertiesfile.wavefront.tracing.red-metrics-custom-tag-keys=envIf your application uses Spring Boot 3, add the configuration shown below to your application's
application.propertiesfile.management.wavefront.trace-derived-custom-tag-keys=envAdd the configuration shown below to the
<wavefront_config_path>/wavefront.conffile. See Paths to find out where the file is saved.traceDerivedCustomTagKeys=env - Save the changes, restart the application, and start sending data.
- Once the data is ingested, create a chart that compares the data sent by each environment. Here’s an example:
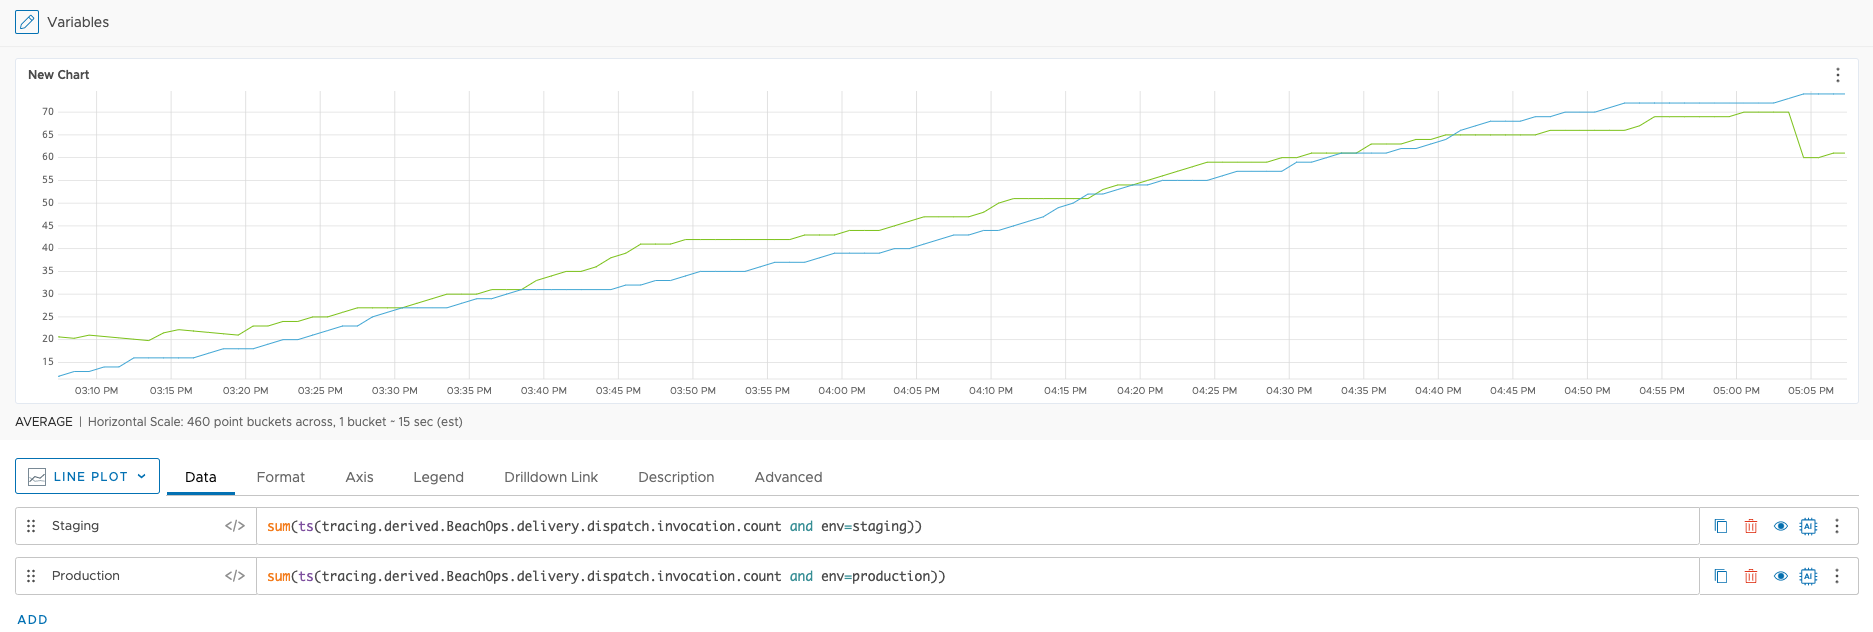 Note: You won’t see this data on the default service dashboard. If you want to customize the queries on the default service dashboard to see data from the custom span tags, you must clone and edit the dashboard.