A cloud-scale web application generates a very large number of traces. VMware Aria Operations for Applications (formerly known as Tanzu Observability by Wavefront) supports sampling to reduce the volume of stored trace data.
How It Works
Let’s look at the following scenarios to understand how sampling works:

Not all the trace data that you send to Operations for Applications is useful. When traces arrive, Operations for Applications identifies the important traces and those that add value to you and retains them. This process is known as Intelligent Sampling.
However, when intelligent sampling is on, you might not see some traces when you search for them on the traces browser. If you and don’t want that certain traces are discarded, use Sampling Policies. With a sampling policy in place, Operations for Applications does not perform intelligent sampling on the data sampled by the sampling policy
Creating a sampling policy affects your cost because Operations for Applications services more data for you.
To see the number of spans stored per second after a sampling policy is created, see Track Volume of Stored Trace Data
Benefits of Sampling Data
Sampling has the following advantages:
- Reduce the amount of storage required for trace data, and lower your monthly costs.
- Only see traces that add value to you.
- Limit the performance impact on network bandwidth and application response times.
Intelligent Sampling
Operations for Applications automatically performs intelligent sampling to reduce the volume of ingested traces. The goals of intelligent sampling are to retain traces that are likely to be informative, and to discard traces that are redundant or otherwise not worth inspecting.
Intelligent sampling gives preference to:
- Traces that are abnormally long, as compared to other traces for the same endpoint.
- Traces that contain at least one individual span that is abnormally long, as compared to other spans for the same operation.
- Traces that contain at least one span in which an error occurred.
We use proprietary algorithms to decide which traces to retain (sample) and which traces to discard (not sample). When analyzing whether a trace is worth retaining, Operations for Applications compares the trace’s characteristics to a historical context that is composed of similar traces. The historical context is based on the RED metrics that Operations for Applications derives from the entire set of trace data that your application has emitted before any sampling occurs. This allows us to determine whether an analyzed trace is a true outlier.
Intelligent sampling applies to entire traces after Operations for Applications receives them. If you have set up an explicit sampling strategy, then the output of your explicit sampling strategy is the input to intelligent sampling.
Intelligent sampling is performed by the Operations for Applications service itself, not by the proxy or by an instrumented application. Consequently, intelligent sampling does not place any additional processing burden on your proxies or applications. Intelligent sampling does not add to your total cost of operation (TCO). If you already use one or more proxies to ingest your time-series data, you can start ingesting and sampling trace data without adding more hardware to support more proxies.
debug=true. Make sure to remove the annotation once you are done troubleshooting and don’t overuse the annotation. For details on adding span tags via the Wavefront proxy, see Proxy Preprocessor Rules.You can monitor your span storage by checking the following internal metrics. If you have set up sampling, these metrics report the number of spans after sampling takes place.
| Metric | Description |
|---|---|
~collector.tracing.spans.reported |
Number of spans per second being sent via a Wavefront proxy. |
~collector.direct-ingestion.tracing.spans.reported |
Number of spans per second being sent directly to Operations for Applications (direct ingestion). |
Sampling Policies
If you can’t find traces because Intelligent Sampling discarded them, create a sampling policy to let the Operations for Applications service know that you want to keep specific spans. Sampling policies impact the volume of spans that are ingested and can affect your costs. See your Service Agreement for cost details.
See Managing Sampling Policies for details.
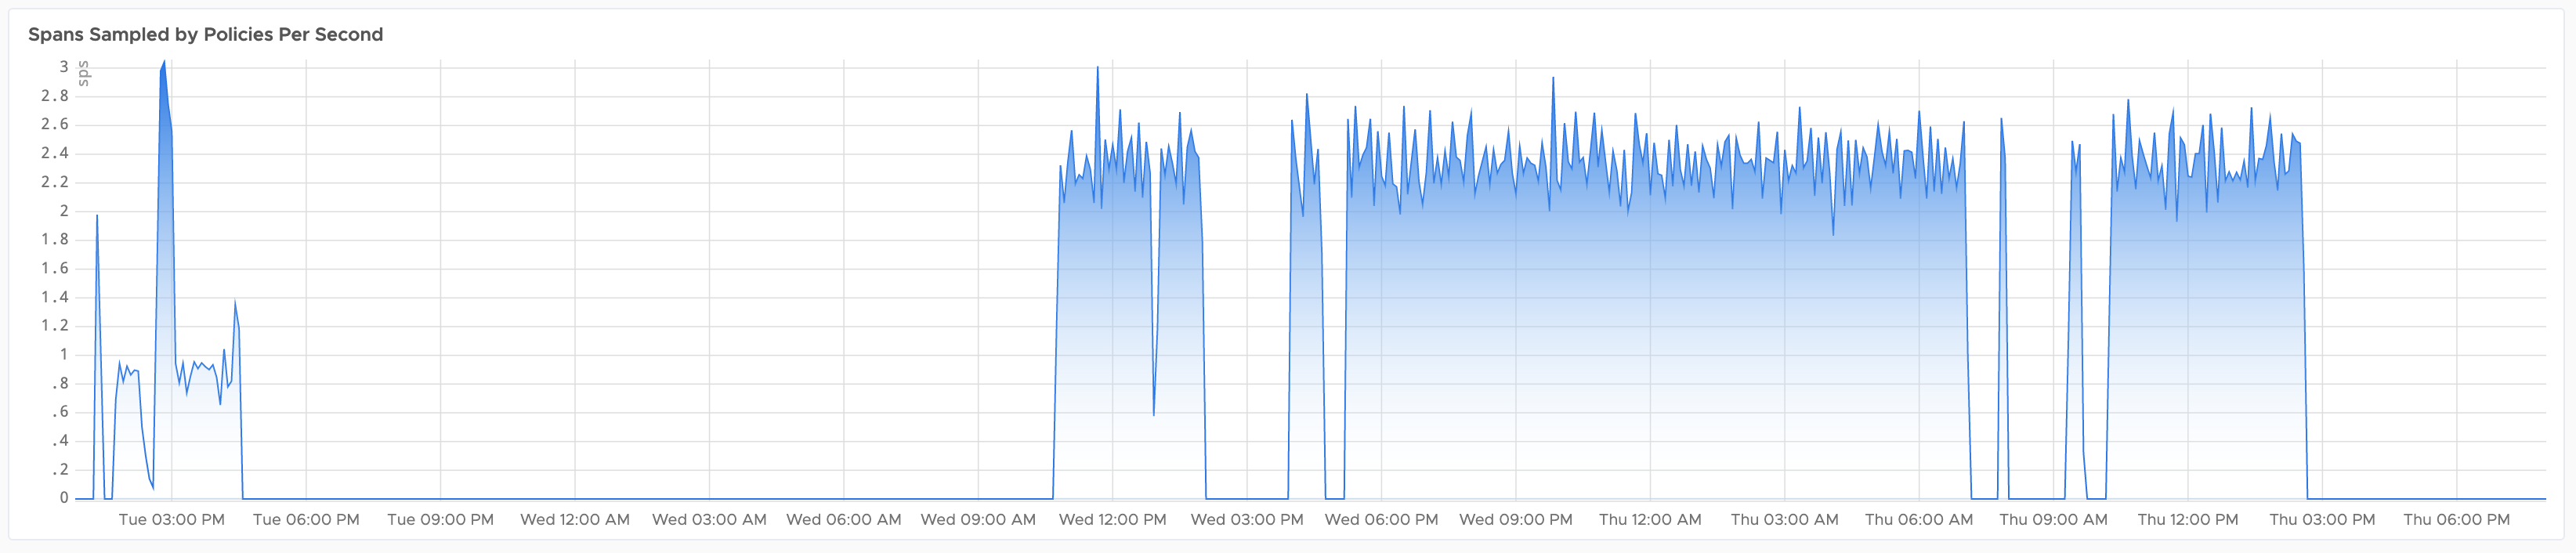
Track the Volume of Stored Trace Data
A sampling policy affects your costs because more data might be sent to Operations for Applications. To see the number of spans you store after the sampling policies are in effect:
- Click Dashboards > All Dashboards.
- Search for the Operations for Applications Service and Proxy Data dashboard and click it to navigate to the dashboard.
- On the dashboard, search for the Spans Sampled by Policies Per Second chart under Proxies overview.
You see the number of spans stored per second.
Explicit Sampling Strategies
An explicit sampling strategy is a mechanism for selecting which traces to forward to Operations for Applications. You can set up an explicit sampling strategy by configuring the Wavefront proxy. We support the following explicit sampling strategies:
Explicit Sampling Strategy Overview
| Sampling Strategy | Description |
|---|---|
| Rate-based sampling | Sends N percent of the generated traces to Operations for Applications. Sometimes called probabilistic sampling. For example, a sampling rate of 10% causes 1 out of 10 traces to be sent and ingested. |
| Duration-based sampling | Sends spans only if they are longer than N milliseconds. For example, a sampling duration of 45 sends spans to Operations for Applications only if they are longer than 45 milliseconds. |
Complete vs. Partial Traces
An ingested trace can be complete (a trace ingested with all of its member spans) or partial (a trace that is missing one or more spans). The completeness of the traces in a sample depends in part on the sampling strategy:
-
Rate-based sampling attempts to send complete traces. That is, the sampler selects the specified percentage of trace IDs, and then sends all of the spans that belong to each selected trace. A partial trace can occur if it has spans from multiple services, and you use sampling policy to set up different sampling rates for those services.
-
Duration-based sampling considers only individual spans. That is, the sampler selects all spans of an appropriate duration, regardless of whether they form complete traces.
Result of Combining Explicit Sampling Strategies
You can combine rate-based sampling and duration-based sampling in the same service. Doing so causes Operations for Applications to ingest the union of the spans that are selected by each sampler.
For example, suppose you set the sampling rate to 20% and the sampling duration to 45ms for the same service. This causes Operations for Applications to receive:
- 20% of the traces generated by that service, regardless of the length of their spans.
- Any additional spans outside of that 20% that are longer than 45ms.
As a result, the ingested sample will contain somewhat more than 20% of the generated traces, with some spans that are shorter than 45ms.
Setting Up Explicit Sampling Through the Proxy
You can set up explicit sampling strategies through a Wavefront proxy by adding the sampling properties to the proxy’s configuration file.
- On the proxy host, open the proxy configuration file
wavefront.conffor editing. The path to the file depends on the host. - Add the
traceSamplingRateproperty, thetraceSamplingDurationproperty, or both to thewavefront.conffile. See Tracing Proxy Properties.
In the following example, thetraceSamplingRateproperty sends 10% of the trace to Operations for Applications and thetraceSamplingDurationproperty sets the minimum sampling duration to 45 milliseconds:# Number from 0.0 to 1.0 traceSamplingRate=.1 ... traceSamplingDuration=45Important: If you have more than one proxy, each proxy must have the same value for thetraceSamplingRateproperty. If different proxies send different percentages of spans to your Operations for Applications service, you get incomplete traces. - Save the
wavefront.conffile. - Start the proxy.