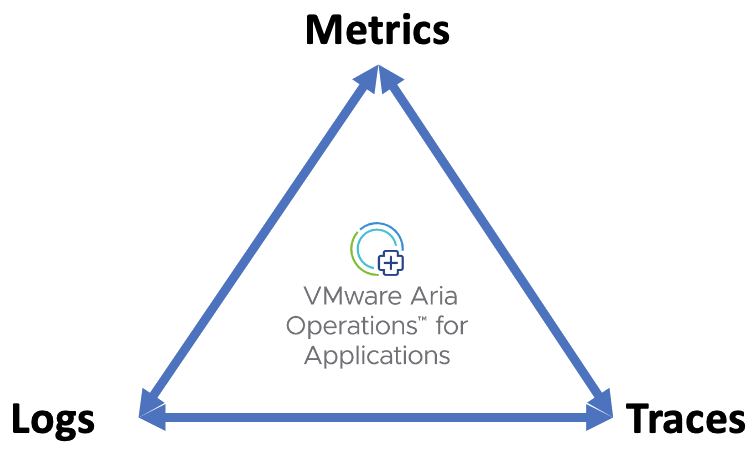
VMware Aria Operations for Applications helps you monitor your application using metrics, traces, and logs.
For example, you can:
|
|
- Our service retains logs for 30 days during the Logs free trial or retains logs for 7 days when on the freemium subscription! To retain logs for a longer period, contact your account representative or technical support.
- Only users with the Logs permission can view the Logs Browser and drill down into logs from charts, alerts, and traces. See for details..</p>
What’s a Log?
Logs are structured or unstructured text records of events that took place at a given time. Our service ingests logs in JSON or JSON Lines format.
Log Attributes
Each log has required attributes, standard attributes, and custom tags. We tokenize the values of these attributes and tags, so that you can filter and search logs.
| Required attributes |
|
| Standard attributes |
These attributes are required if you want to drill into logs from charts and traces.
|
| Custom Tags |
You can send logs with additional custom tag key-value pairs of your choice.
Make sure the custom tags are low-cardinality tags. Many of the recommendations in Optimizing Data Shape to Improve Performance apply. |
Log Data Format Example
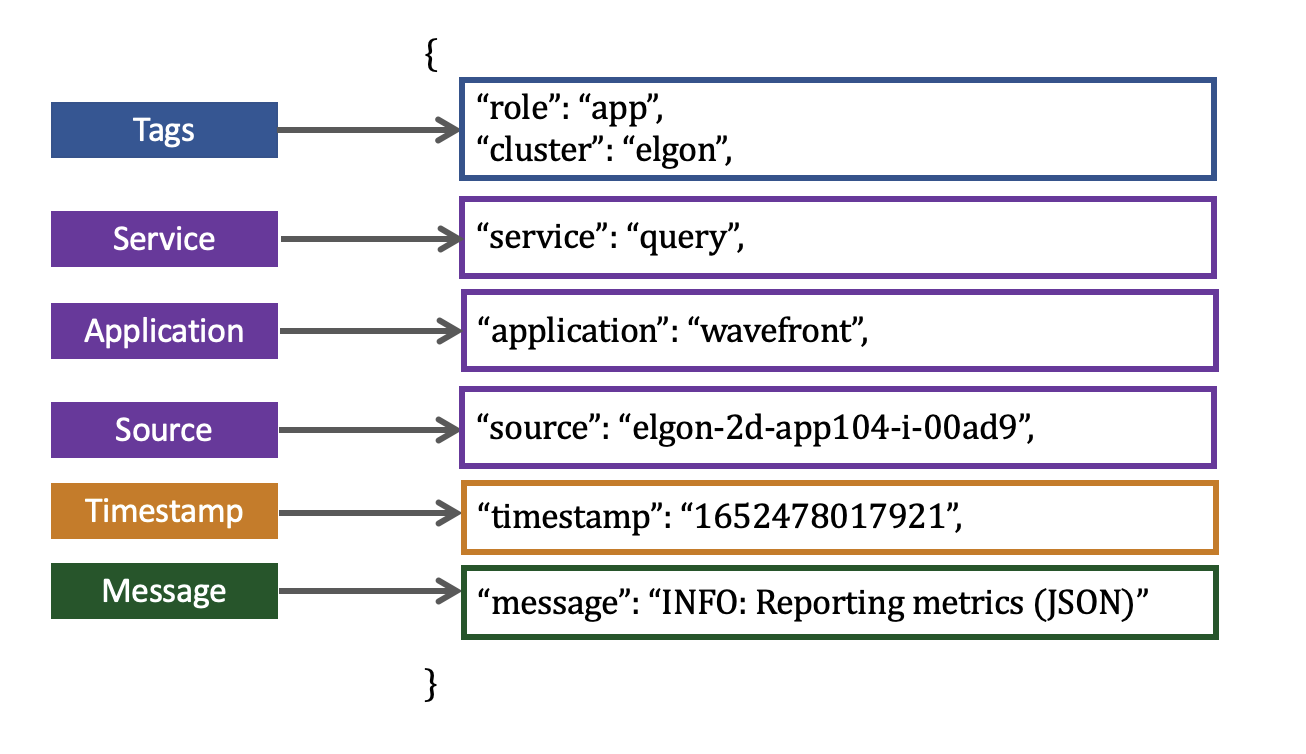
 |
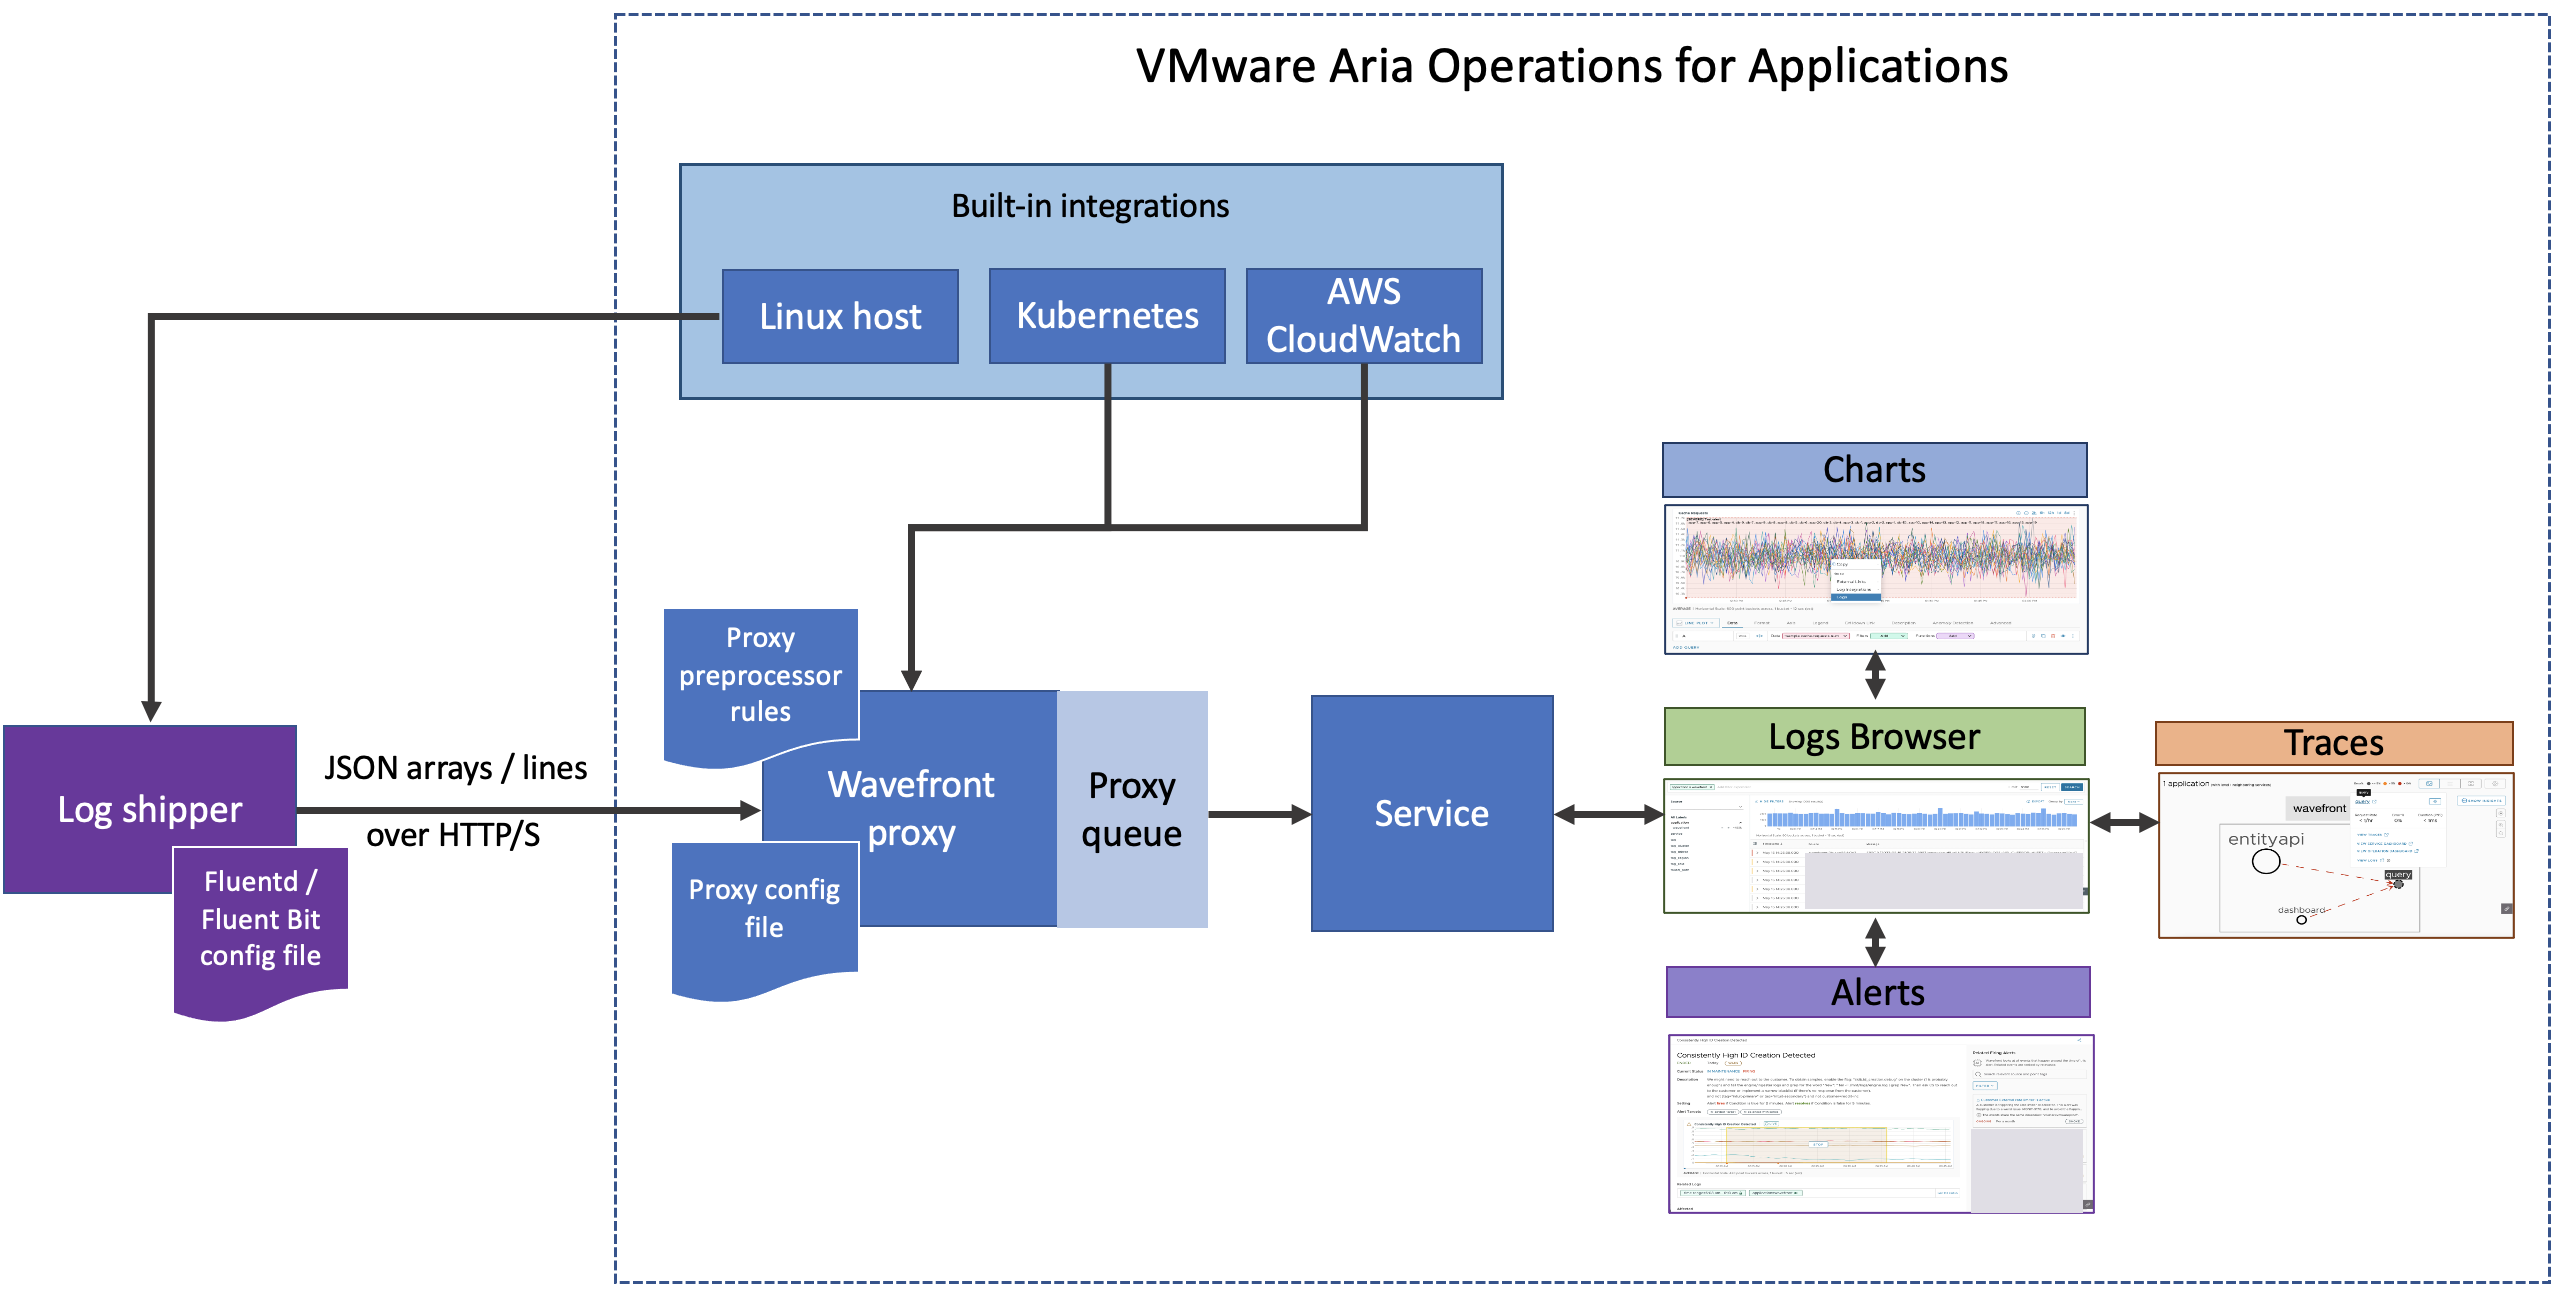
Send Logs
You can send your logs using a log shipper, such as Fluentd that sends logs as JSON arrays over HTTP, or Fluent Bit that sends logs as JSON lines over HTTP. See Send logs to our service.
|
View Logs and Troubleshoot
When logs start flowing into our service, as a user with the Logs permission, you can:
- Go to the Logs Browser directly to view and explore logs.
- You can create a logs chart on a dashboard so you can troubleshoot faster.
- Drill into the Logs Browser from charts, alerts, application map, and the Traces Browser.
- Customize log settings
- If your metrics, logs, and traces have different tags, you can map the metrics and traces tags to the log tags.
- Customize the time window on a chart or Traces Browser when drilling into logs from a chart and trace.

|
Learn More!
- Send logs.
- View and browse logs.
- Learn about the proxy configurations and proxy preprocessor rules for logs.
- See Logs troubleshooting.