An event is a record that something of interest has happened. For example, the event might show that an alert has changed state, AWS instances have started or stopped, and so on. To view the list of all events, select Browse > Events.
By default, events are displayed as small dots on the X axis of most charts. You can choose to display an event overlay to give users more detail, and you can further customize the event display using events queries.
Videos
Watch these videos to get you started! Note that these videos were created in 2017 and some of the information in them might have changed. They also use the 2017 version of the UI.
| Introduction to Events |
Events let you know that something important just happened. Jason shows the Events page and discusses the 3 types of event sources: System, Alert, and User. He then uses filters to drill down on certain events. You can also watch the video here |
| Creating an Event |
Operations for Applications creates System events and Alert events for you. You can create User events via the UI or API to signal that something of interest has happened. Jason demos how to create an event from a chart and shows how it immediately appears in the UI. You can also watch the video here |
| Controlling Event Displays |
Jason demos how to display or hide source events in charts. Then he shows an example of adding an events query to a chart to display only selected events. He customizes the query to also show events when a specific user receives an email alert. You can also watch the video here |
Event Sources and Types
An event can have one of the following sources.
- System/Alert – When an alert fires or resolves, the source is System/Alert.
-
System – When you perform actions, such as when you edit an alert or snooze an alert, or when newly affected sources fail or recover from an alert condition, the source is System.

- The CloudTrail integration retrieves EC2 event information and creates System events that represent the EC2 events. See CloudTrail Integration.
- For Microsoft Azure, some information from the Azure Activity Log integration is available as events.
- User – You can manually create events with source User to identify user actions. For example, you can create an event for code pushes that affect Operations for Applications metrics but that occur outside Operations for Applications. The event is then available on charts that display the metrics.
Events have types and subtypes, which are typically used in events queries. Types include alert or alert-detail You can see types in the Type column of the Events page.
Event States
Event states differ for system and user generated events:
System Event States
A System/Alert and a System event can be in the Ongoing or Ended state.
- The events are Ongoing until all corresponding alert sources are recovered and the alert is resolved.
- Then the state changes to Ended.
User Event States
A User event can be in the Pending, Ongoing, or Ended state. A User event with a start time in the future has the state Pending.
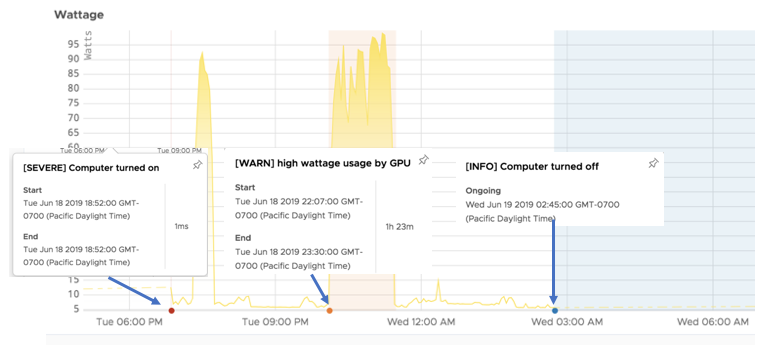
Here’s an example of 3 user events:
- The
Computer turned onevent is instantaneous. It starts and ends at the same time. - The
high wattage usageevent has a start and end time. It’s in the Ongoing state between the start and end time, and then in the Ended state. - The
Computer turned offevent is an Ongoing event. It stays in that state until it is modified with an end time.
The example does not include an event that’s in the Pending state.

To improve event performance, Operations for Applications ends events that have been ongoing for 60 days (based on start time). We also don’t return events for certain ongoing events() queries. See When Does an Event Query Return Events.
~events.num-ongoing-events internal metric to monitor the number of ongoing events.Viewing Events
To view events, select Browse > Events. The Events list displays. Here’s an example event that shows that an alert was triggered.

To view details for an alert associated with a System/Alert event:
- Click Browse > Events and filter by Source SYSTEM or ALERT on the left.
- In the event, click the View Alert link.
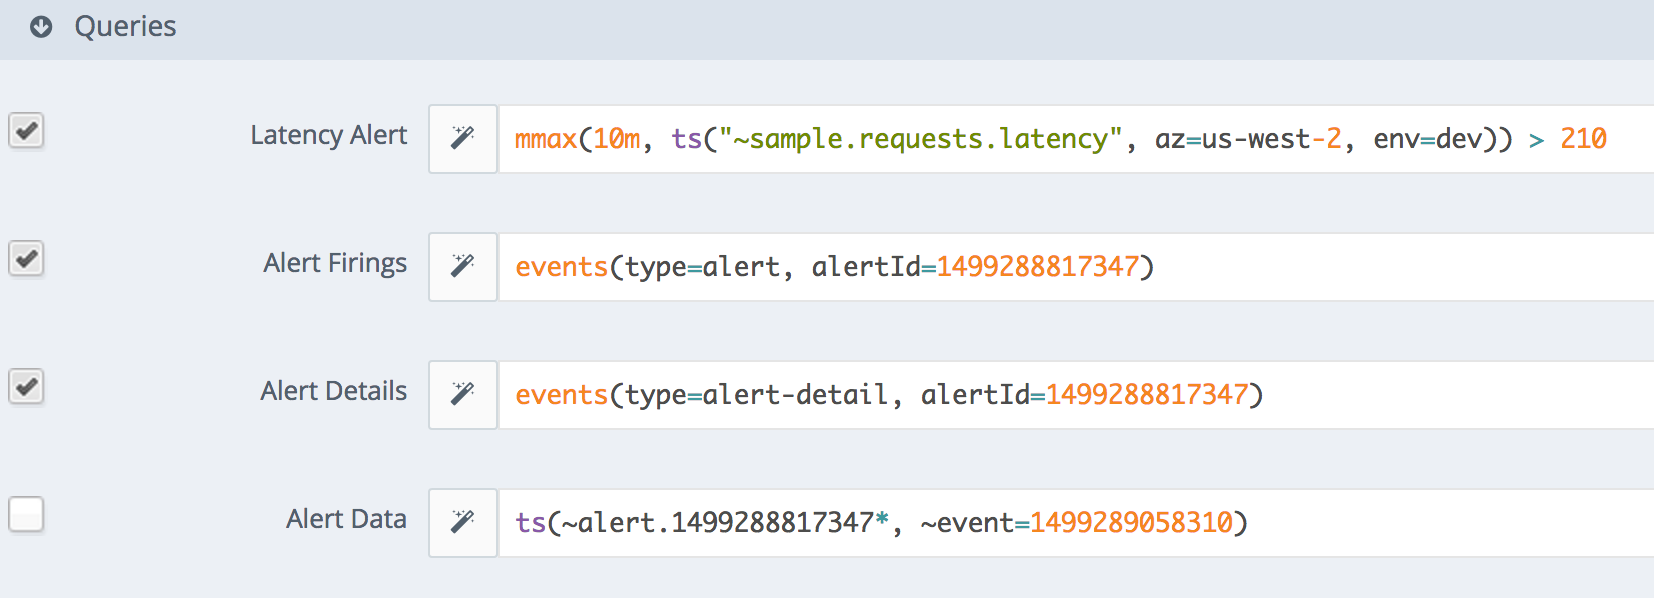
The chart includes information about the alert associated with the event, and about the alert itself:
- <Alert name> - The display expression if one was specified. Otherwise, the alert condition expression. If the display expression is shown, the condition appears in a separate Alert Condition field.
- Alert Firings - An events() query that shows events of type
alertfor the alert. These system events occur whenever the alert is opened. The query shows both the current firing (an ongoing event) and any past firings (ended events). - Alert Details - An events() query that shows events of type
alert-detailfor the alert. These system events occur whenever the alert is updated (continues firing while an individual time series changes from recovered to failing, or from failing to recovered). - Alert Data - A query for alert metrics. These metrics are shown when the alert is open or updated.

Creating a User Event
Operations for Applications creates many events for you, but you can also create an event explicitly:
- Do one of the following:
- Select Browse > Events and click the Create Event button on top.
- From within a new chart, click the flag icon in the top right corner. Hover over the chart and set your cursor at a point in time. To make the event instantaneous, click that point. If the start and end time for the desired event are included in the current time window, click, hold, and drag across the window.
- Fill in the event properties:
Property Description Name Name displayed on the Events page and when you hover over an event icon on the X-axis of a chart. Type Type of the event, such as code push. Keep the type short. You can enter additional information about the event in the Details field. You later can enter the type as a parameter in events() queries. Start Time The start time of the event: - Now - The maintenance window starts immediately.
- - The maintenance window starts on the specified date and time. Click the text field to select the start time.
End Time The end time of the event: - Instantaneous - End the event instantaneously with the start time. The exact interval is indeterminate. The Events page can report that the event starts and ends at exactly the same time or that it lasts a few seconds.
- Ongoing - The event does not have a specified end time. You can manually end (close) the event from the Events page. Operations for Applications closes events that are older than 60 days.
- - End the event at the specified day and time. Click the text field to select the end time.
Classification The event classification: SEVERE, WARN, INFO, and UNCLASSIFIED. You can enter that classification as a parameter in events() queries. Tags Tags to associate with the event. You can start typing to select existing tags or create new event tags. Details Additional details about the event. Display Event in Chart Whether to add the events query to the chart so users can examine it later. Displays only when you create an event from a chart. - Click Save.
Event Closure and Deletion
Operations for Applications closes any event that is older than 60 days, based on start time. You can explicitly close events and delete user events if you have the right permissions.
Closing an Event
You can close an event if you no longer need it. It’s especially important to close ongoing events, which do not have an end time.
To close ongoing events:
- Click the check box(es) next to the event(s).
- Click the Close button.
If the Close button is grayed out, you don’t have permissions to close the selected events.
Deleting User Events
To delete one or more user events:
- Click the check box(es) next to the event(s).
- Click the Trash icon at the top of the Events page.
If the Trash icon is grayed out, you don’t have permission delete the selected events.
Learn More!
- See Organizing with Tags for details on managing event tags.
- See Displaying Event Overlays in Charts for details on customizing event overlays.
