You can prevent alerts from firing by using one of the following techniques:
- To disable alert checking immediately, you can snooze an alert.
- To disable alerts from firing for a set of sources or alerts during a custom time window, you can create a maintenance window.
- To prevent an alert from ever firing for a set of sources, you can configure the alert condition to exclude those sources.
- To prevent an alert from firing outside of certain hours, you can alert only between specific times.
Snooze and Unsnooze Alerts
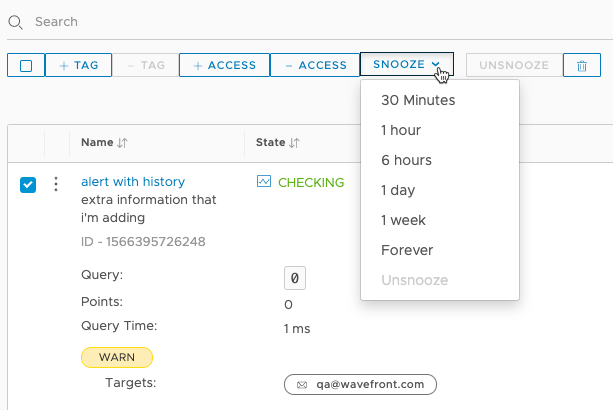
You can snooze an alert, so it doesn’t fire even if the condition is met. You can snooze one or more alerts for 30 minutes, 1 hour, 6 hours, 1 day, 1 week, or Forever. If you choose Forever, the alert doesn’t fire until it is unsnoozed.
To snooze or unsnooze one or more alerts:
|
 |
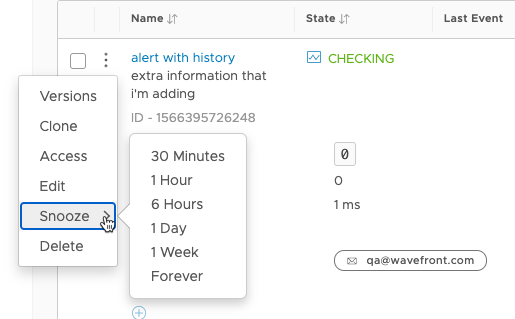
To snooze or unsnooze a single alert:
|
 |
Maintenance Windows
Maintenance windows prevent alerts from firing. Use them, for example, when disruptive operations occur as a result of system maintenance or testing.
You can:
- Create a maintenance window to prevent alerts from firing. You can target the maintenance window only to certain sources, alert tags, point tags, etc.
- Close (end) maintenance windows early or make them longer.
- Extend selected maintenance windows.
- Send alert notifications to an alternate alert target during the maintenance window.
To view and manage maintenance windows, select Alerting > Maintenance Windows.
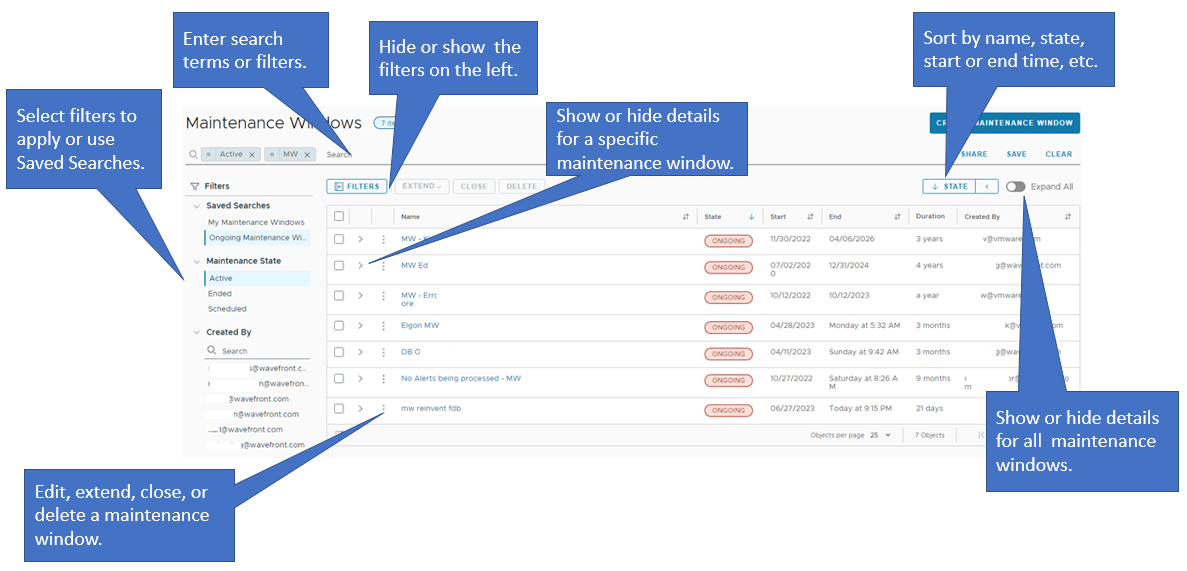
On the Maintenance Windows Browser, you can:
- Search for and apply filters to the maintenance windows so that you can narrow down the results.
- Share, save, and clear search results.
- Browse through a list of saved searches.
- Hide or show the filters and the saved searches list displayed on the left by clicking the Filters button.
- Sort the maintenance windows by name, creator, start or end date and so on, in descending or ascending order.
- Show the details for all maintenance windows by turning on the Expand All toggle. By default, this setting is turned off.
- Show the details for a specific maintenance window by clicking the arrow next to the check box of the window.
- Edit, extend, close, or delete a single maintenance window by clicking the ellipsis icon and selecting the respective option from the menu.
- Select the check boxes of multiple maintenance windows, extend. close or delete them by clicking the Delete button.
Watch this video for an introduction to maintenance windows. Note that this video was created in 2017 and some of the information in it might have changed. It also uses the 2017 version of the UI.
Creating a Maintenance Window
Creating a maintenance window consists of these simple steps:
- Specify required information, including description and start and end dates.
- Narrow down the scope. By default, no alerts fire during the maintenance window. You can target only specific alerts, for example, alerts for sources or environments that will be in maintenance.
- Optionally, specify one or more alternate alert targets. By default, no notifications are sent during the maintenance window.
Step 1: Specify Required Maintenance Window Fields
- Click Alerting > Maintenance Windows from the toolbar.
- Click the Create Maintenance Window button.
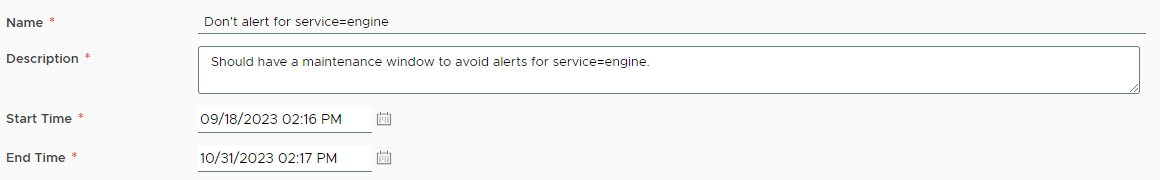
- Specify the Name and Description for the maintenance window.
- Specify the Start Time and End Time for the maintenance window.
Step 2: Narrow Down the Scope
By default, the maintenance window stops all alerts during the specified time. Usually, you’ll want to stop only alerts from a specific set of sources, or in a certain availability zone or environment. For example, you could specify a set of hosts that you expect to take down, or decide not to alert for a certain point tag (e.g. env=dev). You could also specify a set of sources with a certain source tag, for example, if you know that an availability zone will be temporarily offline.
Specify one or more of the following:
- Alert Tags: Type one or more alert tag names to suppress any alert that has one or more specified alert tags. All alerts are included if you don't specify alert tags.
- Point Tags: Suppress any alert that has the specified alert tags and one or more specified point tag. Example: "dev".
- Sources: Type one or more source names to suppress any alert on a source that has a matching source. Example: "app-14"
- Source Tags: Type one or more source tag names to suppress any alert on a source that has a matching source tag.

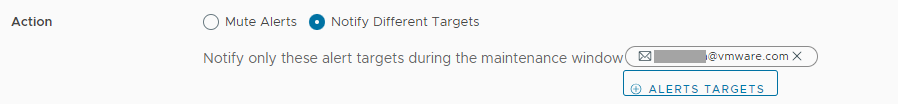
Step 3 (Optional): Specify Alternate Alert Targets
By default, no alert notifications are sent during the maintenance window. The alert is mute. You can instead specify alternate alert targets to notify during the maintenance window.
Maintenance Window Example
Suppose you have a group of alerts that are used primarily as demo examples. These alerts have alert tag paths such as example.latency.dev, example.latency.prod, example.network.dev, example.network.prod, and so on.
To suppress the example alerts, you create a maintenance window as shown above, and fill in Affected Alerts and Sources according to your use case:
- To suppress all of the example alerts from firing on any source:
- In Affected Alert Tags, specify the tag path
example.*.
- In Affected Alert Tags, specify the tag path
- To suppress just the example production alerts from firing on the source named
app-1:- In Affected Alert Tags, specify the tag path
example.*.prod. - In Affected Sources, specify
app-1.
- In Affected Alert Tags, specify the tag path
- To suppress just the example latency alerts from firing either on a source that has the source tag
EastCoastSources, or on the source namedapp-1:- In Affected Alert Tags, specify the tag path
example.latency.*. - In Affected Source Tags, specify the source tag
EastCoastSources. - In Affected Sources, specify
app-1.
- In Affected Alert Tags, specify the tag path
app-1 only if that source also has the source tag EastCoastSources, you can click on OR and select AND.Extend a Maintenance Window
You can extend the duration of a maintenance window. To extend one or more maintenance windows:
|
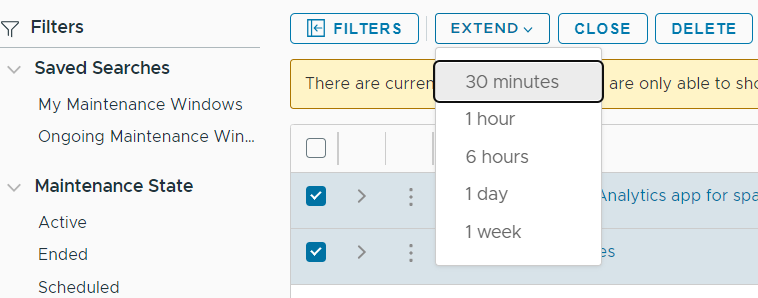 |
To extend a single maintenance window, click the ellipsis icon on the left of the window, click Extend and select the desired duration.
Close a Maintenance Window
You can close the window to enable alerts before the window is scheduled to finish.
- Select Alerting > Maintenance Windows.
- Select the check boxes next to the maintenance windows to be closed.
- Click the Close button and confirm.
To close a single maintenance window, click the ellipsis icon on the left of the window and click Close.
Editing or Deleting a Maintenance Window
To edit or delete a maintenance window, click the ellipsis icon on the left of the window and click Edit or Delete.
Exclude Sources from an Alert
You can exclude sources from an alert by configuring the alert condition so that it filters out source tags that are associated with the sources to be skipped. Doing so prevents the metrics on the source from triggering the alert.
Suppose an alert condition tests the metrics that flow from sources app-1, app-2, …, app-10. You decide to decommission app-2 and replace it with a new app-11. The following steps cause the alert to filter out the metrics from the decommissioned source:
- Add a source tag such as
decommissionedtoapp-2when you are ready to take that source out of service. - Modify the alert condition to include
and not tag=decommissioned, for example:ts(~sample.cpu.usage.percentage, source=app-* and not tag=decommissioned) > .5.
Use Point Tags to Set a Maintenance Windows
It’s often helpful to use data that are stored in a point tag to determine which time series should be affected by a maintenance window. For example, you might want to do testing on points in one environment.
The general idea of this strategy is to make point tags be part of the source name. The aliasSource() function is key to this strategy.
Example Overview
For this example:
-
Data points include an
envpoint tag. A query returns this information:metric name: prod.my-app.requests source name: app-name point tags: env=prod, az=east, cluster=1a, shard=shard-a - The
aliasSource()function is used to add theenvvalue to the source name (app-name/prod). - The maintenance window is set up so it applies only to data points that come from the
prodenvironment.
You can create maintenance windows based on the environment of the app in a few steps:
Step 1: Include the Point Tag Value in the Source Name
The env point tag contains the environment information, and you need to access the value of that point tag when you configure a maintenance window. Suppose we still wanted to keep the current source name intact. One approach you is to use this query in our alert condition:
aliasSource(ts(prod.my-app.requests), /)
As described in the aliasSource() documentation, you can use variables to obtain the value of components of a data point, including that of a specific point tag. If we use aliasSource() the query above returns:
metric name: prod.my-app.requests
source name: app-name/prod
point tags: env=prod, az=east, cluster=1a, shard=shard-a
The value of the env point tag (prod in the example) is now part of the source name (app-name/prod). The original source name and the environment are separated by a slash. (Other formats work as well, adjust for your own use case.)
Step 2: Set Up a Maintenance Window Based on the New Source Name
Now that the source name includes the environment information, you can create a maintenance window.
- Follow the steps in Creating a Maintenance Window
- When you get to Step 2, use the specified source name (
app-name/prod) in the Affected Sources field. For this example, the affected sources look like this:

This maintenance window will affect alerts that have time series from the prod environment.
Query for Known Downtimes or Events
Maintainance windows or testing windows result in expected downtime periods. You can exclude these known downtimes from uptime calculations by excluding the times when the maintenance window is active. This section uses the events() and ongoing() functions to find known downtimes.
Step 1: Query for Maintenance Window(s)
To query for maintenance window(s), use the events() function and filter by maintenance window name. For example, if a maintenance window name is OS Upgrade, the query is:
events(name="OS Upgrade")
Step 2: Determine When the Maintenance Window Is Inactive
When calculating uptime, we only care about time periods with no active maintenance windows. The ongoing() function returns 1 when the underlying maintenance window is active and 0 otherwise. To determine when the maintenance window is inactive, we can check when the result is 0:
ongoing(events(name="OS Upgrade")) = 0
Step 3. (Optional) Match Granularity of Uptime Calculation
The ongoing() function returns a continuous time series (returns data every second continuously). To use this data in uptime calculations, we match the granularity.
For example, if you are calculating uptime in minutes, then the data that tells us when maintenance windows are active also has to be in minutes. We use the align() function to accomplish this:
align(1m, min, ongoing(events(name="OS Upgrade")) = 0)
This example assumes:
- The uptime calculation is in minutes.
- If the Maintenance Window is active during any portion of a minute, we want to exclude that entire minute from uptime calculations.
The query uses a summarization strategy of minimum (min()). If at any second within a minute the maintenance window is active, the ongoing() query returns 1. When comparing that with 0, the result is 0, and the result of the align() function is 0 for that minute.
Step 4. Calculate Uptime
This step varies depending on how you are calculating uptime. For our example:
- We have a set of canary data that reports at 1-minute intervals when a service is up.
- We make sure that periods of active maintenance windows are not included in uptime data.
By using AND, we only account for time periods when the maintenance window inactive query returns 1. Service actually availabl return 1 when there are no Maintenance Windows AND the service is up.
We can use this data to calculate uptime by comparing the number of minutes the service was truly available with the time period of interest. For example, to calculate uptime percentage over the last 24 hours, we use this query:
- We use the
msum()function to determine how many minutes over a 24-hour time window the service was truly available (there are 24 * 60 minutes over a 24-hour time window). - We multiply by 100 to get a percentage rather than a decimal.