You use alerts in VMware Aria Operations for Applications (formerly known as Tanzu Observability by Wavefront) to get notified when something out of the ordinary happens. Alerts monitor your environment’s behavior and send notifications based on how you configure the alert.
This page has some best practices from our Technical Support engineers to help you set up truly useful alerts and avoid common problems with alerts.
Know Your Data!
If you don’t know your data before you create charts and alerts, results can be confusing. It’s even possible that your query times out because of system overload. Some extra time spent examining your data can help you avoid a lot of troubleshooting time later.
Before creating queries and alerts, make sure you understand the following aspects of your data.
Fixed Interval?
Question: Does the metric report regularly, i.e., at a fixed interval?
For metrics that do not report at a fixed interval, alerts are only useful if you select the appropriate aggregation method.
-
You can base the query condition on the last value reported, the sum of the values, or the average of the values depending on what nuance you want your query to capture.
-
Operations for Applications evaluates alerts once every 5 minutes by default. The Checking Frequency in the Alert page’s Advanced Settings allows you to change the default (minimum is 1 minute).
Example 1: Suppose you have a metric that reports the number of failures since server restart. If the metric reports 25 failures at 1:24, and 25 failures at 1:25, that could mean nothing has changed. However, it could also mean that within a minute, 10 failures resolved and 10 new failures appeared. It could even mean that within a minute, total failures dropped to 2, jumped up to 100, and came back down to 25. For this use case, your alert can’t just check the number of failures once a minute. Instead, the alert has to look at a metric that captures the total number of failures that happened over time.
Example 2: Suppose your metric returns values that represent new failures several times per minute. You want to generate an alert based on the total number of failures per minute. In this case, you can sum the values into minute buckets rather than relying on the alert behavior–which averages those values by default–. Or you can average those values to see how many seconds it took to get an error response.
Only Non-Zero Values?
Question: Does the metric report only non-zero values, or does it also report zero values?
If your metric includes zero values, or if blips in the network might result in temporary zero values, our Technical Support team recommends that you use cumulative counter metrics, which represent increasing numerical values.
Your data might already come in as counters, for example, the uptime for a system. Or you can explicitly set up a counter to count tasks completed, errors occurred, etc. For example, sum(ts(cpu.idle)) is a counter metric. It increases over time, and never reports zero values.
For alerts, follow these guidelines:
-
Counters are especially helpful for alerts: Even if there’s a break in the data flow, the alert doesn’t immediately get triggered because a counter always has a value. You can instead have the alert check whether the value didn’t change for a specified amount of time.
-
If a counter doesn’t make sense, delta counters might work. Delta counters record changes between the last metric and the current metric. Delta metrics that report zero values are more useful for alerting than deltas that don’t report zero values.
If you know your data, you can pick a suitable metric to get the best results for your alert. Or you can use functions like sum to create your own counter.
Danger of Becoming Obsolete?
Question: Might this metric become obsolete because it doesn’t report values (e.g., no failures)?
We consider a metric obsolete after it hasn’t reported any values for a certain period of time (by default 2 weeks). The obsolescence period might vary because it is a configurable setting. You can see your current configuration by looking into the Advanced settings of any chart or dashboard. To change this configuration, contact Technical Support.
For example, if your obsolescence period is 2 weeks and you monitor http.failures, the metric becomes obsolete if no failures occurred for 2 weeks. To avoid this, you can monitor http.failures.count or wrap count around the http.failures metric, so that the metric is cumulative and does not become obsolete.
The UI allows you to include or exclude obsolete metrics in several places. For alerts, you can select the Advanced check box Include Obsolete Metrics.
As discussed above, it’s usually better to find a way to report values, for example by using a counter or delta counter, than to include obsolete metrics.
Simultaneous Metrics?
Question: Do some of the metrics report at exactly the same moment?
If an alert uses two metrics in its condition, for example, ts(metric1)/(metric2), you have to find out whether these two metrics report at exactly the same time.
If metrics report at the same time, it might be better to use raw aggregate functions and not interpolating aggregate functions There is no default in this case:
- With standard aggregation functions, interpolation will occur
- With raw aggregation functions, interpolation does not occur.
Don’t use interpolation if metrics show deltas to avoid results like 4.5 processes running.
Aligned to Time Interval?
Question: Is this metric aligned to the minute (or any other interval)?
By default, alert checking frequency is 5 minutes, and alert condition queries are evaluated with 1 minute granularity. If more than 1 data point comes in per minute, consider explicitly aligning your data to 1 minute using the summarization strategy appropriate for your use case (e.g., sum, max, last etc). If you don’t specify a summarization strategy, Operations for Applications uses avg, which computes the mean. If your data points are coming in much less frequently than once a minute, consider adjusting the alert’s checking frequency advanced option.
Near Real Time or Back-Filled?
Question: Is this metric reporting in near real time or is it back-filled in chunks?
For some data sources, for example AWS, the metric is backfilled in chunks, and your alert has to take that into account. For example, if the metric is backfilled in 10-minute chunks, avoid setting Minutes to Fire to less than 10 minutes, or use moving time window functions to make sure all the incoming data is visible to the alert.
Does the Query Work for the Data Shape?
Data shape refers to the reporting behavior of the alert data. Behavior such as how often data is reported, the intervals associated with reporting, and a lag in real-time data can all result in an alert that doesn’t match your expectations.
For example, imagine you want to trigger an alert when the total number of errors reported across 10 VMs exceeds expectation. The data shape can impact how you should construct your alert condition query. For this example, pay attention to the following data shape behavior to ensure that your alert meets expectations:
-
Reporting behavior when no errors occur: Some environments send a value of 0 if no errors occurred at a reporting interval, while others omit a reported value. If there’s no reported value, you might need the default missing data function to correctly handle the omitted value.
-
Reporting intervals: Even though each VM in this example likely has the same reporting frequency, the reporting interval may be staggered. It usually makes sense to calculate the
total number of errors reported across 10 VMswith an aggregation function. But staggered reporting in conjunction with an aggregation function introduces interpolated values. Consider whether you want to use a raw or non-raw aggregation function. See Aggregating Time Series for background and a video. -
Lag in real-time data: If the Operations for Applications service receives the error data with a 5-minute lag, then you need to consider that when setting the Alert Firing time window or constructing your query.
- If the alert is set to evaluate a 3-minute time window of real-time data, then there would be no reported values to evaluate during the check.
- If you look at the data 20 minutes after the fact, you see that the total number of errors were exceeded. You can increase the Trigger Window or use the lag() function to get the correct behavior (alert fires).
Plan and Test!
Effective alerts require planning and testing. Here are some things to keep in mind to avoid unexpected problems:
Compose the query carefully. You can create alerts directly from the Alerts Browser page or by selecting Create Alert from the ellipsis icon menu on the right of a query.
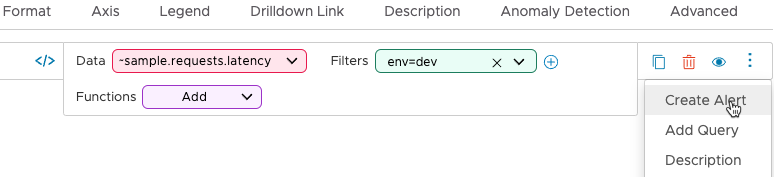
In both cases, but especially when you create the query from scratch, it’s important that you compose the query carefully. In some cases, the default settings for alerts work well, but in other cases it makes sense to change them. See Recommendations for Alert Settings
-
Know your data. Understanding your data is essential for creating useful and meaningful alerts. See Know Your Data above.
-
Test your alert. Make sure the alert fires when you expect it does. With alerts, it’s possible to get false positives (alert fires when you didn’t expect it) or false negatives (alert does not fire when you expected). False positives are usually easier to debug than false negatives.
- Watch out for changes to the metrics. If your data changes and your alert remains the same, the alert might no longer work as expected. For example, if your alert monitored environments tagged with
env=prodandenv=dev, and the environment names change, the alert can no longer detect problems. Retest alerts after changes to the data and update as needed. - Keep stakeholders informed. Inform your team if you change the alert to avoid confusion about unexpected behavior.
- Pick a suitable aggregation strategy. Make sure the alert works for the type of metrics that you are collecting. The aggregation strategy depends on the data. What the chart shows you and what the alert acts on are different aspects of the data.
- Chart: In a chart, nuances might be hidden, but the alert might expose information that the chart doesn’t show.
- Alert: Alerts check only once per minute by default, so the alert might not catch certain changes.
Select Time Windows Carefully
If your alert doesn’t have constant time window that’s long enough to account for data delays, alert behavior can become very confusing.
Use a Constant Time Window in the Query
Use a constant time window in your alert queries – and don’t use 1vw.
If you use 1vw in a chart, the query applies to the time window selected for the chart the user looks at. But if you use 1vw in an alert query, view window that is used in the alert condition defaults to:
- When the alert is not firing, the minutes to fire for the alert.
- When the alert is in Firing state, the minutes to fire or minutes to resolve for the alert (whichever is greater)
Consider Data Delays
Data coming from certain sources, such as cloud applications, are often batched and arrive at your alert at unpredictable times. You can Limit the Impact of Data Delays by making sure you understand the issue and by fine-tuning the query and time window.
Follow Alert Settings Recommendations
Consider carefully which values are best suited for the settings you specify in the Alerts UI.
-
Minutes to Fire - Alerts with very short Minutes to Fire time windows can jump over a problem spot and not fire. This might happen in case of delays in the metric pipeline or if Alert Check Frequency is higher than Minutes to Fire.
For example, if Minutes to Fire is 5m, and the Checking Frequency is 10m, data might meet the condition within the 5-minute time interval, but the alert never fires because the checking frequency is too high.
To trigger an alert with a single value, instead of
ts(critical.event.count) > 0with 1 minute to fire and 30 minutes to resolve, usets(critical.event.count) != 0with 30 minutes to fire and 30 minutes to resolve. The alert still fires immediately when the first non-zero value is encountered. -
Alert Check Frequency - Decrease alert check frequency, that is, increase the interval, for non-critical alerts. Check when the alert really matters to you and check only as often as you must. In development environments, check less frequently.
Increase alert checking frequency for conditions that use larger moving time windows, or align to a large interval. An alert that compares a
mavg(6h, ...)tomavg(48h, ...)can be safely checked once an hour or even less. -
Minutes to Fire and Alert Check Frequency. Set Minutes to Fire to be no less than Alert Check Frequency unless you use moving time windows.