VMware Aria Operations for Applications (previously known as Tanzu Observability by Wavefront) supports both PromQL and Wavefront Query Language (WQL) queries. The Query Editor includes admin-level organization settings for enabling PromQL and a query line GUI that includes a translation option.
- Users with an administrative role in Operations for Applications have control over user defaults:
- On the Organization Settings page (New User Defaults) they can enable users to write queries in PromQL.
- If queries in PromQL are enabled, they can also set other options.
- Users can then type PromQL or WQL queries into the Query Editor.
- If users enter a PromQL query when PromQL is selected, or a WQL query, when WQL is selected, the Query Editor parses the query. The corresponding chart shows the information you’d expect.
- If users enter a PromQL query when WQL is selected, or the reverse, the Query Editor doesn’t parse the query and displays a syntax error.
- In PromQL mode, users can see the translation to WQL and translate the query if that is set in their preferences.
- Users can add charts that use PromQL to dashboards, create alerts from charts that use PromQL, and use PromQL queries in the query line of a Create Alert page.
Set PromQL Organization Settings (Administrator Only)
As a user with an administrative role, you can control user defaults.
- If PromQL Support is not enabled, other users cannot use PromQL or change PromQL user preferences.
- If PromQL Support is enabled, administrators can set additional New User Default query settings, and other users can override those settings.
To set PromQL settings for your organization:
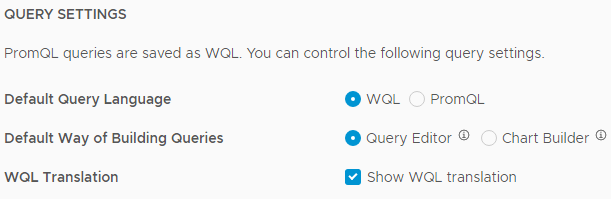
- From the gear icon, select Organization Settings.
- Under Query Settings, select the Users can write queries in PromQL check box.
- Select the default query language for new users.
-
Select the default way for building queries.
If the default language is set to PromQL, the only way to build queries is to use the Query Editor.
-
Enable Show WQL translation to show the translation for all PromQL queries.
Select this check box if you expect that users want to learn WQL. The translation appears only if the query is with a valid PromQL syntax. Otherwise, you see an error.
Set PromQL User Preferences (All Users)
If an administrator has enabled PromQL support (discussed above), each user can control some aspects of PromQL.
- From the gear icon, select your username.
- Under Query Settings, select:
- The default query language.
-
The default way of building queries.
If your default language is set to PromQL, you can build your queries only in the Query Editor. Chart Builder was designed for Wavefront query language and doesn’t support PromQL.
- Whether to show the translation to WQL when you click inside the Query Editor.
Video: Wavefront Query Language and PromQL
This short video shows how you can create a PromQL chart and an alert. Note that this video was created in 2021 and some of the information in it might have changed. It also uses the 2021 version of the UI.
Use PromQL in Charts and Alerts
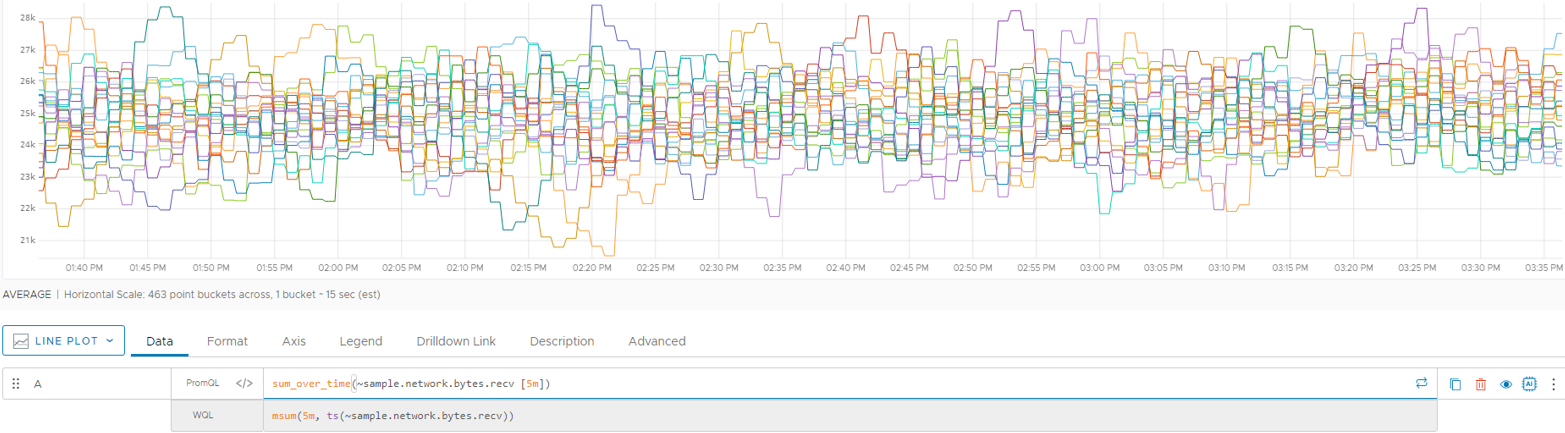
This example shows how to use PromQL, when:
- An administrator has enabled PromQL support.
- The default query language is set to be WQL.
- The translation to WQL is enabled.
If your preferred default language is PromQL, and you have selected to not see the translation to WQL, the button for converting to WQL is not available.
|


|
Next, you can make changes to the visualization.
- See Create and Customize Charts for an intro.
- See Chart Reference for details.
Frequently Asked Questions
Operations for Applications supports most PromQL functions and operators out of the box. There are a small number of differences.
FAQ: Do You Have Best Practices?
A few functions work differently in PromQL and WQL. Here are some best practices.
| rate() | If you use the PromQL rate() function on an instant vector in a chart, provide the time resolution.rate(metric[xm:ym]) where x is time span length, y is the resolution, m is the time unit minute. If you include the time resolution, the query engine will automatically call align() on the translated query. If you don't include the time resolution, you might get different results depending on the monitor resolution. See Chart Resolution for details on how your monitor's resolution can affect how the chart looks. |
| count_values() | The PromQL count_values aggregation function is not supported. Histograms and histogram functions allow you to perform the corresponding tasks - and more! |
| topk(), bottomk() | The topk() and bottomk() functions work slightly differently in PromQL and WQL.
In the Query Editor, topk() and bottomk() always return results based on the time series. |
FAQ: Can I Use Variables?
Dashboard variables are a powerful feature for fine-tuning what users see when they look at a dashboard.
- Users with Dashboard permissions can create dashboard variables.
- All users can select dashboard variable values at the top of dashboards, and can specify variables inside a query. When the query engine runs the query, it automatically substitutes the current value of the variable with the selected value for the dashboard.
This approach to variables is different from PromQL variables:
- If the dashboard variable represents the actual value (or glob), use
=. - In the rare case that you want to explicitly use a regex, use
=~
FAQ: Can You Show Me a Query Example That Doesn’t Translate?
In many cases the translation from PromQL to WQL is straightforward. You type the PromQL query into the query editor and click WQL to see the corresponding query in WQL.
However, the syntax for for joining queries in PromQL and in WQL is fundamentally different. In addition, WQL does not support ignore, on, group_left, and group_right for vector matching with PromQL queries. However, after a bit of practice (and after looking at our examples and this video we expect you’ll find joins in WQL quite powerful.
Joining Queries in WQL and PromQL
Wavefront query language has several options for combining time series with joins. Here’s a summary of the syntax:
join(<<WQUERY1>>  AS ts1
INNER JOIN
<<WQUERY2>> AS ts2
USING(<<HOW TO JOIN METRICS>>),
metric='<<NEW METRIC NAME>>',
<<OUTPUT COLUMNS>>,
ts1 (edited)
In <<HOW TO JOIN METRICS>>, you specify the new output metric, the source you want to focus on, point tags in the output, and the value you want to use, as in this example:
metric='cf_app_memory_used_gb',               //New output metric name.
source=ts2.application_name,                  //What do you want to use as source.
<<OUTPUT COLUMNS>>,                           //Source and point tags in output.
ts1                                           //What value do you want to use as value
In PromQL, you specify Query 1, how to join the metrics, the output colums, and Query 2, as follows:
(<<QUERY1>> + on(<<HOW TO JOIN METRICS>>) group_left(<<OUTPUT COLUMNS>>) (<<QUERY2>>)
This section shows an example for how 2 queries can be combined with joins in WQL and PromQL.
Example Join in WQL
The following example joins two WQL queries (WQL 1 and WQL 2) using an inner join.
WQL 1:
ts(kubernetes.pod_container.status, cluster="a-cluster" and nodename="ip-*" and pod_name="a-pod" and namespace_name="a-namespace" and status="running")
WQL 2:
ts(kubernetes.pod_container.uptime, cluster="a-cluster" and nodename="ip-*" and pod_name="a-pod" and namespace_name="a-namespace")
WQL Join:
join(${WQL Q1} AS ts1 INNER JOIN ${WQL Q2} AS ts2 USING( cluster, nodename, pod_name, namespace_name ), metric='pods.running.uptime', source=ts2.source, cluster=ts1.cluster, nodename=ts1.nodename, pod_name=ts1.pod_name, namespace_name=ts1.namespace_name, ts2)
See Inner Join Example for a discussion.
Example Join in PromQL
The following example joins two PromQL queries (PromQL 1 and PromQL 2).
PromQL 1:
kubernetes.pod_container.status{cluster="a-cluster",nodename="ip-*", pod_name="a-pod", namespace_name="a-namespace", status="running"}
PromQL 2:
kubernetes.pod_container.uptime{cluster="a-cluster",nodename="ip-*", pod_name="a-pod", namespace_name="a-namespace"}
PromQL Join:
${PromQL Q1} * on(cluster,nodename,pod_name,namespace_name) group_left(status) ${PromQL Q2}
FAQ: Does WQL Support Recording Rules?
For expressions that are needed frequently or computationally expensive, PromQL supports creating recording rules, which allow you to save the expression result as a set of time series. The derived metrics feature is similar.
It’s not currently possible to translate a query that includes recording rules. However, advanced PromQL users can:
- Break down their PromQL query into small-ish pieces.
- Use the Query Editor translation feature for each piece.
- Create a derived metric for one or more of the short queries.
Limitations
Because the two languages are different, some limitations exist.
Unsupported PromQL Functions
| sort(), sort_desc() | PromQL sort() and sort_desc() show the data order in the Console view. Because you visualize WQL queries in charts (not a console), we don't support this option. |
| ignore, on, group_left, group_right | WQL does not support ignore, on, group_left, group_right for vector matching with Prometheus queries. |
Limitations in WQL Query Editor
- Autocomplete is not currently supported for PromQL functions and operators. However, autocomplete for metrics that you use inside your query continues to be supported.
- The Wavefront query language supports using a query name as a chart variable in other queries for the same chart.
- You can use a query name as a chart variable in a PromQL query if the named query was also a PromQL query.
- You cannot use a query name as a chart variable if the named query is a WQL query.
How the Query Engine Executes PromQL Queries
The following diagram shows how the query engine handles a WQL (ts()) query and a PromQL query.

The top row shows the ts() query execution:
- The user enters the query into the Query Editor.
- The query engine processes the query and shows the results in the chart. It also uses the result to determine whether an alert should fire, etc.
The bottom row shows the PromQL query execution:
- The user enters the query into the Query Editor.
- The translation service translates the query into the corresponding
ts()query. - The translated query is automatically sent to the query engine.
- The query engine processes the query and shows the results in the chart. It also uses the result to determine whether an alert should fire, etc.
More Info
New to our product? Here are some links to get you started:
- Videos
- Watch videos in the Getting Started playlist on VMware TV
- Watch videos in the How to Query with WQL and PromQL playlist on VMware TV
- Tutorials & Other Info