VMware Aria Operations for Applications (formerly known as Tanzu Observability by Wavefront) provides observability for several different metric types including time series metrics, delta counters, histograms, and traces/spans. This page looks at the anatomy of a time series metric and shows you how to explore it in the Metrics Browser.
Videos
The following videos get you started. Note that these videos were created in 2020 and some of the information in them might have changed. They also use the 2020 version of the UI.
| Browsing Your Data |
90-second video that shows how you can find and examine metrics from the Sources browser and from the Metrics browser. You can also watch the video here |
| About Cardinality |
Wavefront co-founder Clement Pang explains why the concept of cardinality is so important for observability, what high cardinality means, and why we deal so well with high cardinality input. You can also watch the video here |

You can also watch the following videos to learn more about working with metrics:
Time Series Metric Structure
A time series has, at a minimum, the metric name, value/timestamp, and source. In many cases, the metric is ingested with additional information represented as tags.
Simple Time Series
Here’s one example that shows the minimum elements of a time series.
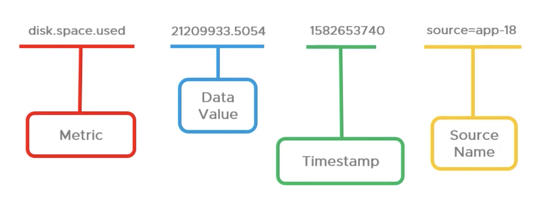
Each time series is a unique combination of:
- Metric name–Describes the metric. There’s often a hierarchy of metrics, each with a corresponding time series.
- Value & Timestamp–Value at the specified time.
- Source–The source of the metric. Host, VM, etc. In contrast to some other observability platforms, this dimension is always part of the metric.
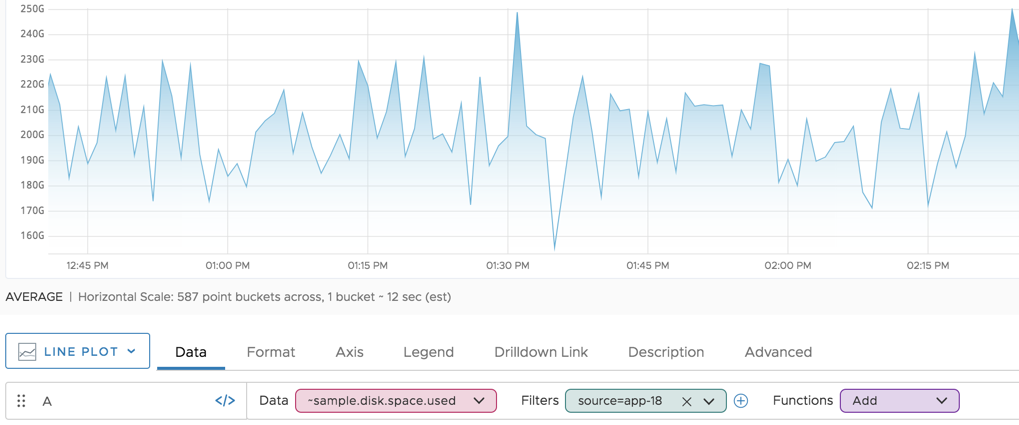
Here’s a screenshot of the time series that is shown in the diagram above in a chart.
Time Series with Tags
In most cases, the time series includes one or more tags to allow a more fine-grained analysis. The ~sample data you can find on each service instance include point tags for environment and availability zone.
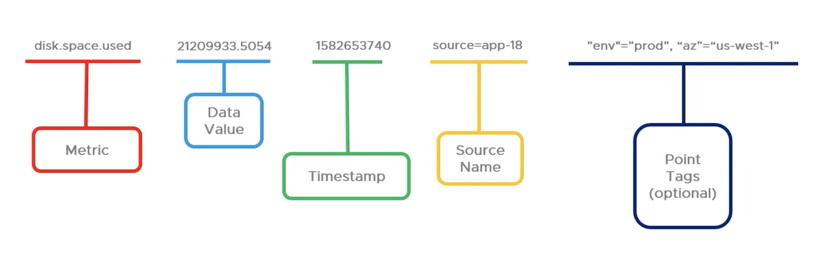
Point tags offer a powerful way of labeling data so that you can slice and dice it in almost any way you can imagine. For example, you can use point tags, to label a point’s datacenter, version, etc. and can then group by datacenter or version.
You use point tags to add extra dimensions to your data, and can then focus your exploration just on that dimension.Fine Tune Queries with Point Tags explains how to use point tags.
Here’s a screenshot of the time series that includes point tags in a chart.
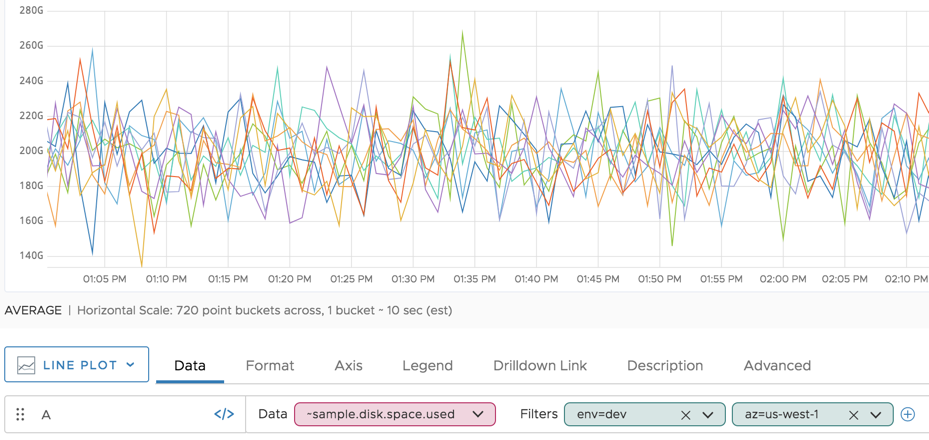
How Filtering with Tags Improves Usability
How the point tag filters are useful becomes obvious when the source= filter is removed. The result of all time series for ~sample.disk.space.used is visually confusing.
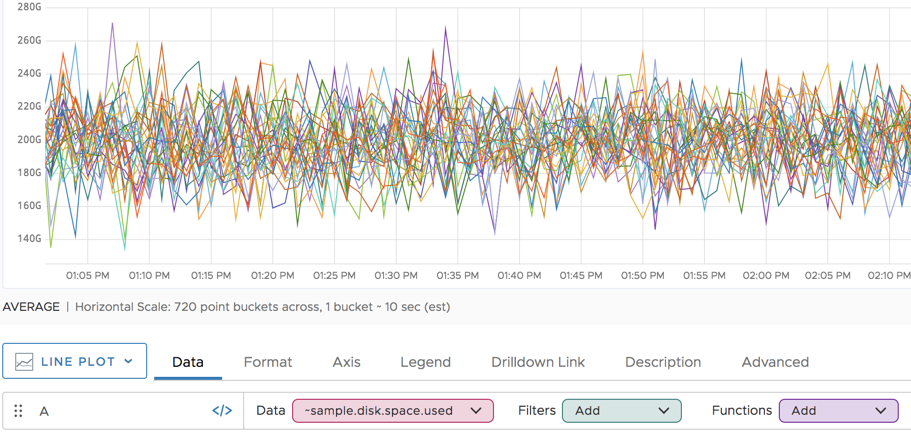
When you add filters for env and az, the information makes sense.
Obsolete Metrics
If a metric stops sending data points for a certain period of time (obsolescence period), it becomes obsolete.
In the Metrics browser and Query Editor, obsolete metrics are no longer shown in the autocomplete drop-down lists.
Metrics Browser
Select Browse > Metrics to display the Metrics Browser. Use the Metrics Browser to find metrics that are actively sending data points.
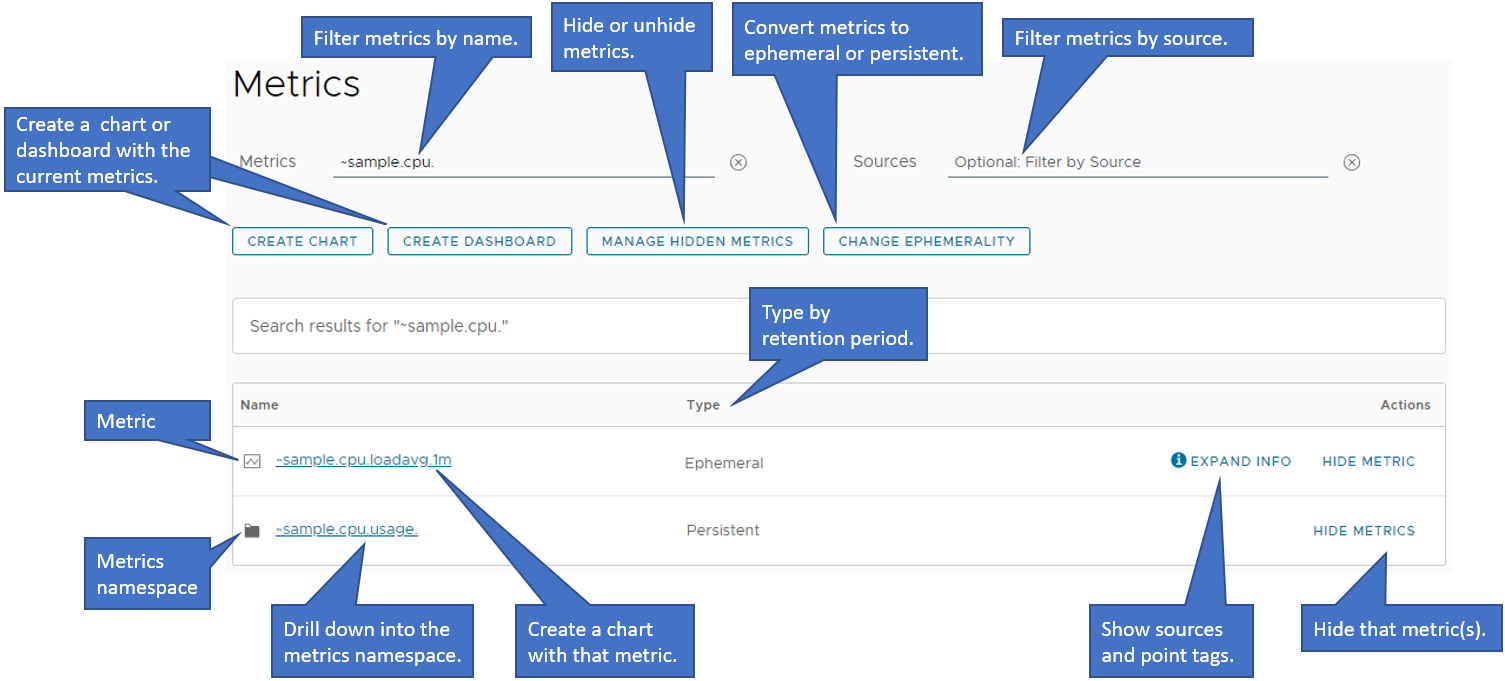
On the Metrics Browser, you can:
- Drill down and go up the hierarchy.
- Filter by name or source.
- Hide and redisplay individual metrics or metrics namespaces to unclutter your page.
- View the metric type in terms of retention period - persistent or ephemeral.
- Convert persistent metrics to ephemeral and the reverse. Most of the internal metrics are ephemeral and not convertible.
- Create a chart or dashboard for an individual metric or for the current set of metrics.
- View the sources and point tags for an individual metric.
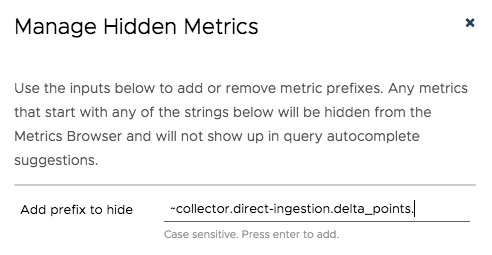
Hide and Redisplay Metrics
While obsolete metrics are automatically hidden, you can manually hide metrics from the Metrics browser. Manually hiding metrics does not permanently delete a metric or metric namespace.
To hide one or more metrics:
|
 |
To view hidden metrics:
|
 |
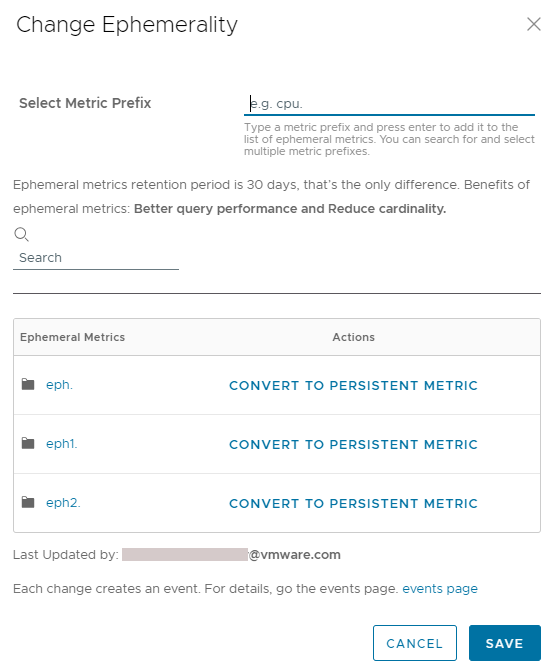
Change the Retention Period of Metrics
With the 2024-05 release, we introduce ephemeral metrics, which have short retention period. By default, all ingested metrics are persistent but are convertible to ephemeral.
Converting persistent metrics to ephemeral can significantly improve the query performance and reduce the cardinality.
|
 |
Changing the retention period of a metric or metrics namespace creates a System event:
- Converting a persistent metric to ephemeral creates a System event with the name
Ephemeral Prefix: Added <metric_name>. - Converting an ephemeral metric to persistent creates a System event with the name
Ephemeral Prefix: Removed <metric_name>.
Learn More!
- Optimizing the Data Shape to Improve Performance
- See the KB article Migrating Objects or Data Between Operations for Applications Environments if your company has several service instances.