An alert target provides a template that specifies how VMware Aria Operations for Applications (formerly known as Tanzu Observability by Wavefront) extracts information from the alert, and how to assemble the notification from the alert information.
You can customize the predefined template for the alert target type by making and saving changes. The template uses Mustache syntax to combine literal text with variables and functions to produce the structures to be sent to the receiving messaging platform.
About Alert Target Templates
The template defined by a custom alert target describes the contents of the notifications that will be sent whenever an alert transition triggers an event.
Here’s what happens:
- The alert triggers an event.
- The alert template:
- Identifies the information you want to extract from the alert
- Embeds that information in a formatted structure appropriate for the target’s messaging platform.
- Operations for Applications sends the formatted information to the target.
- The messaging platform interprets the structure and displays it as a readable notification.
For example:
-
A template for an HTML email alert target specifies the HTML structure that will be sent as the message body, and specifies the alert information to be included within that structure. Each piece of alert information is inserted as a value of an HTML element or attribute.
-
A template for a Slack alert target specifies the JSON structure that will be POSTed to the Slack endpoint, and specifies the alert information to be included within that structure. Each piece of alert information is inserted as a value of a Slack-defined JSON attribute.
Predefined Templates
We provide a predefined template for each type of custom alert target. You can use the predefined template as is, or you can customize it.
You can inspect a predefined template to see:
-
The variables and functions that extract information from the alert.
-
The structural elements in which the extracted information is embedded. These are JSON attributes, HTML elements, or plain text, depending on the messaging platform to which notifications will be sent.
The predefined Slack and VictorOps templates contain JSON attributes defined by the messaging platform. See the product documentation for the platform for details.
Template Variables
We define template variables for accessing information about the alert and about the time series tested by the alert. When the alert triggers a notification, Operations for Applications replaces the variables in the template with strings that represent the requested values.
We support property and iterator variables, which are used differently.
-
A property variable accesses a single value. For example,
alertIDaccesses a single string that represents the alert’s unique ID.Each property is enclosed in 3 pairs of curly braces. (In an HTML email template, you can use 2 pairs of curly braces around a property.)
-
An iterator variable accesses a value that is a list of elements. For example,
alertTagsaccesses a list of 0 or more strings that represents tags associated with the alert.Each iterator is used in a Mustache section, with the iterator’s name appearing on either end. Because an iterator successively visits each element in its list, you can use
{{{.}}}within the section to indicate the element currently being visited. The section normally contains additional literal text and functions to format each visited element, such as a following comma or other separator character.
Mustache supports several variations in each case.
Template Functions
We define template functions for performing various tasks, such as tailoring the notification content to the trigger type, limiting the number of elements an iterator can return, and assisting with JSON or XML formatting.
The following snippet shows the basic Mustache syntax for two functions:
Like iterators, a function is used in a Mustache section, with the function’s name appearing on either end. The contents of the section are passed as input to the function.
Display and Edit Predefined Templates
To display and edit a predefined template for a new or existing custom alert target:
|
 |
Obtain Information About the Alert
We define variables for obtaining information about the alert as a whole, such as the alert ID, timing, severity, and so on. Each of these variables is a property unless explicitly described as an iterator.
General Information About the Alert
| Variable | Definition |
|---|---|
additionalInformation |
Text in the Additional Information section of the alert. |
alertId |
ID of the alert that triggered the alert target. |
alertTags |
Iterator returning 0 or more tags associated with the alert that triggered the alert target. |
condition |
Alert condition query. |
errorMessage |
Deprecated. Look at the updateMessage variable instead for information about the alert. |
updateMessage |
Information about the alert, for example, information about the affected series. |
hostsFailingMessage |
Message containing a list of the sources of the failing time series. These are time series for which the alert condition returned all true (non-zero) values for the duration of the Trigger Window. |
imageLinks |
Iterator returning URLs to chart images. Currently returns 1 URL to the chart image that shows the alert’s display expression at the time the alert fired or was updated. |
name |
Name of the alert. |
notificationId |
Unique ID of the notification being sent to the alert target. |
reason |
Trigger that caused the alert target to send the notification, e.g., Alert Opened or Alert Snoozed. |
subject |
Subject of the notification (usually for email). If you omit this variable, the subject is composed of the alert severity, alert trigger, and alert name. |
url |
Link that shows the alert in the Alert Viewer. |
chartUrl |
Link to an interactive chart that shows alert firing events or resolved events along with the alert condition. |
alertRoute |
Route associated with alert target. Route allows you for example, to notify when a subset of hosts is failing. If defined a Webhook alert target, you can use the route in the notification template to send the alert to a different alert target. Another option to get this behavior is multiple alerts. See Add Custom Alert Routes for background. |
heading |
User-visible string for the alert state. Here's how the internal alert state maps to the user-visible string (in double quotes)
|
secureMetricDetails |
Customers set this property in environments that use Metrics Security Policies. See Secure Metric Details |
Time-Related Information About the Alert
| Variable | Definition |
|---|---|
createdTime |
Time the alert was created. |
createdEpoch |
Time the alert was created, in Epoch format. |
endedTime |
Time the alert ended (resolved). |
endedEpoch |
Time the alert ended (resolved) in Epoch format. |
sinceTime |
Time elapsed since the alert started firing. |
sinceEpoch |
Time elapsed since the alert started firing, in Epoch format. |
snoozedUntilTime |
Time when a snoozed alert is scheduled to be unsnoozed. |
snoozedUntilEpoch |
Time when a snoozed alert is scheduled to be unsnoozed, in Epoch format. |
startedTime |
Time the alert started firing. |
startedEpoch |
Time the alert started firing, in Epoch format. |
Examples
Example: Accessing Alert Information in a Generic Webhook Alert Target Template
This portion of the Generic Webhook alert target template uses variables that access information about the alert.
Example: Alert Information in Output From the Sample Template
Here is sample alert target output generated with the preceding template:
Notice that, in a template entry such as "alertId": "{{{alertId}}}", everything except the variable is literal text that is passed through as output. So, for example:
"alertId": " "is literal text that produces a sample JSON attribute called"alertId".{{{alertId}}}invokes the variablealertId, which expands to1460761882996in our example.
Obtain Information About the Alert’s Time Series
We define variables for obtaining information about the time series that contributed to the alert’s state change. Each of these variables is an iterator that visits the time series in a particular category, and returns one of the following kinds of information about the visited series:
- Each series’ source (host) *
- Each series’ defining information
- A custom combination of details about each series.
The time series visited by a particular iterator are in one of the following categories:
| Time Series Category | Definition |
|---|---|
| Failing | The time series that caused the alert to fire or update. These are time series for which the alert condition returned all true (non-zero) values for the duration of the Alert fires time window. |
| Newly failing | Any time series that failed after the alert started firing, causing the alert to be updated. These are time series for which the alert condition returned all true (non-zero) values for the duration of the Alert fires time window, while at least one other time series continues to fail. |
| Recovered | Any previously failing time series that is no longer failing, causing the alert to be updated or possibly resolved. These are time series for which the alert condition returned all true (non-zero) values for the duration of the Alert fires time window, and then returned either false (0) values or no data for the duration of the Resolve Window time window. |
| In maintenance | Any time series whose source is associated with an ongoing maintenance window. These are time series that continue to be tested against the alert condition, but whose results do not change the alert’s state. |
<seriesCategory><InfoIndicator>. For example:
-
failingHostsis an iterator that lists the host name of each failing time series. -
inMaintenanceSeriesis an iterator that lists the defining information of each time series whose source is in maintenance. -
recoveredAlertSeriesis an iterator that can access a custom combination of details about each recovered time series.
Extract Information About the Filter-by and Group-by Keys
Starting with the 2023.25 release, users can use iterators to extract information about the filter-by and group-by keys.
| Iterator | Definition |
|---|---|
filterByKVs |
Iterator that returns the key, predicate, and value of each filter-by key in the alert condition:
|
groupByKeys |
Iterator that returns all the group by keys from the alert condition. |
Example: Accessing Filter-by and Group-by Information in a Generic Webhook Alert Target Template
The portion of the Generic Webhook alert target template shows the filter-by keys and group-by keys extracted from the alert condition.
  "filterByKVs": [
    {{#trimTrailingComma}}
      {{#filterByKVs}}
        {
          "key": "{{{key}}}",
          "predicate": "{{{predicate}}}",
          "value": "{{{value}}}"
        },
      {{/filterByKVs}}
    {{/trimTrailingComma}}
  ],
  "groupByKeys": [
    {{#trimTrailingComma}}
      {{#groupByKeys}}
        "{{#jsonEscape}}{{{.}}}{{/jsonEscape}}",
      {{/groupByKeys}}
    {{/trimTrailingComma}}
  ],
Example: Alert Filter-by and Group-by Keys in Output from the Sample Template
Here is a sample alert filter-by and group-by keys output generated with the preceding template:
  "filterByKVs": [
    {
      "key": "env",
      "predicate": "!=",
      "value": "dev"
    },
    {
      "key": "source",
      "predicate": "=",
      "value": "app-5"
    },
    {
      "key": "source",
      "predicate": "=",
      "value": "app-6"
    }
  ],
  "groupByKeys": [
    "az",
    "env"
  ],
Information About Alert Resolution Help
Starting with release 2022.05, users can include information about the alert resolution such as a runbook. We support several variables for extracting or setting those fields.
| Field | Definition |
|---|---|
| runbookLinks | One or more URLs in which information about alert resolution is stored. |
| alertTriageDashboardLinks | One or more dashboard URLs. These are URLs to dashboards that might help you resolve the problem for which the alert was triggered. For example, if an alert fires because of high CPU usage, alertTriageDashboardLinks could be a link to a dashboard that includes charts for monitoring the CPU usage of your system. |
List Sources and Source Tags of an Alert’s Time Series
You can use iterators to visit each time series in the indicated category and return
- The string name of the series’ source (host). Any time series not associated with a source is skipped.
- The string names of the source tags associated with each of sources. For example, corresponding to the
failingHostsiterator, we support aFailingHostSourceTagsiterator that returns the source tags associated with each failing host.
List Sources of an Alert’s Time Series
You can use iterators to visit each time series in the indicated category and return the string name of the series’ source (host). Any time series not associated with a source is skipped.
| Iterator | Definition |
|---|---|
failingHosts |
Iterator that returns the source of each failing time series. |
inMaintenanceHosts |
Iterator that returns each source that is in a maintenance window. |
newlyFailingHosts |
Iterator that returns the source of each time series that has failed since the previous notification. (These source names are also returned by failingHosts.) |
recoveredHosts |
Iterator that returns the source of each time series that has recovered since the previous notification. |
Example: Accessing Alert Sources in a Generic Webhook Alert Target Template
This portion of the Generic Webhook alert target template shows iterators that return the sources of the time series tested by the alert:
Example: Accessing Source Tags Associated with Alert Sources in a Generic Webhook Alert Target Template
This portion of the Generic Webhook alert target template shows iterators that return the source tags that are associated with the sources of the time series tested by the alert:
Example: Alert Sources in Output from the Sample Template
Here is a sample alert target output generated with the preceding template:
Notice that the template provides literal text for enclosing each source name in quotation marks, for separating the source names with commas, and for enclosing the list in square brackets. The trimTrailingComma function suppresses the comma after the last source name.
List Source Tags of an Alert’s Time Series
You can use iterators to list the string names of the source tags associated with each of an alert’s sources. For example, corresponding to the failingHosts iterator, we support a FailingHostSourceTags iterator that returns the source tags associated with each failing source.
| Iterator | Definition |
|---|---|
failingHostSourceTags |
Iterator that returns source tags that are associated with the sources for each failing time series. |
inMaintenanceHostSourceTags |
Iterator that returns source tags that are associated with the sources for each source that is in a maintenance window. |
newlyFailingHostSourceTags |
Iterator that returns source tags that are associated with the sources of each time series that has failed since the previous notification. |
recoveredHostSourceTags |
Iterator that returns the source tags associated with the sources of each time series that has recovered since the previous notification. |
List the Definitions of an Alert’s Time Series
You can use the following iterators to visit each time series in the indicated category and return the series’ defining information. The defining information for a series is a preformatted string that contains the source name, the metric name, and any point tags (shown as <key>=<value> pairs).
| Iterator | Definition |
|---|---|
failingSeries |
Iterator that returns the source, metric name, and point tags of each failing time series. |
inMaintenanceSeries |
Iterator that returns the source, metric name, and point tags of each time series whose source is in a maintenance window. |
newlyFailingSeries |
Iterator that returns the source, metric name, and point tags of each time series that has failed since the previous notification. (These series are also visited by failingSeries.) |
recoveredSeries |
Iterator that returns the source, metric name, and point tags of each time series that has recovered since the previous notification. |
Example: Accessing Time Series Information in a Generic Webhook Alert Target Template
This portion of the Generic Webhook alert target template shows iterators that return the defining information about the time series tested by the alert:
Example: Time Series Information in Output from The Sample Template
Here is a sample alert target output generated with the preceding template:
The template explicitly includes literal text for enclosing the overall list of preformatted strings in square brackets, and for separating the preformatted strings with commas. The trimTrailingComma function suppresses the comma after the last preformatted string. The punctuation (quotation marks, comma separators, and square brackets) in each preformatted output string is generated automatically.
Access a Custom Group of Time Series Details
You can access a custom combination of details for the time series that contributed to the alert’s state change. To do so:
- Use an alert-series iterator to visit each time series in the indicated category.
- Use variable within the iterator section to access the alert-series details you want to include.
This technique gives you complete control over the formatting of the returned information, and allows you to access statistics from each visited time series.
Alert-Series Iterators
Use the following iterators to visit each time series in the indicated category so you can obtain a custom group of details from each visited time series.
| Iterator | Definition |
|---|---|
failingAlertSeries |
Iterator that can return a custom combination of details for each failing time series.
When there is no data in this iterator, you can use the |
inMaintenanceAlertSeries |
Iterator that can return a custom combination of details for each time series whose source is in a maintenance window. |
newlyFailingAlertSeries |
Iterator that can return a custom combination of details for each time series that has failed since the previous notification. (These series are also visited by failingAlertSeries.) |
recoveredAlertSeries |
Iterator that can return a custom combination of details for each time series that has recovered since the previous notification. |
Alert-Series Details
Use the following variables within the section of an alert-series iterator to specify the details to be included for each visited series. You can use any subset of these variables in any order. Use literal text around these items if you want to format them with any labels, separators, or other punctuation.
| Variable | Definition |
|---|---|
host |
Name of the source of the time series being visited. |
label |
Name of the metric of the time series being visited. |
tags |
Iterator that returns a list of the point tags associated with the time series being visited. Each point tag is formatted like this: key=value. To access the value of a specific point tag, use this syntax: {{#tags}}{{pointTagKey}}{{/tags}}
|
observed |
Number of data points returned by the visited time series during the most recent checking time window. |
firing |
Number of data points in the visited series that are preventing the alert from resolving, during the most recent checking time window. The smaller the number, the closer the series is to recovering. This property is useful only for time series visited by failingAlertSeries and newlyFailingAlertSeries.
|
stats |
See Alert-Series Statistics. |
Example: Accessing Alert-Series Details in a Generic Webhook Alert Target Template
This portion of the Generic Webhook alert target template shows how to use the failingAlertSeries iterator to retrieve alert-series details for each time series that failed:
Example: Alert-Series Details in Output from the Sample Template
The preceding template might yield the following message:
Alert-Series Statistics
Statistics provide a profile of the values in a time series during the checking time window immediately preceding a notification. For example, the alert might be set up to fire when a condition is true for 10 minutes. During a 10-minute period where the condition is true, a time series likely have multiple values. You can use statistics to find out, e.g., the largest of these values, or the last value to be reported during the Alert fires time window.
Use the following variables within the section of an alert-series iterator to specify the statistics that you want to include for each visited series. You can use any subset of these variables in any order. Use literal text around these items if you want to format them with any punctuation, separators, or labels.
| Variable | Definition |
|---|---|
stats |
Set of statistics about the values in the visited time series during the checking time window preceding the notification. |
stats.first |
First value reported within the checking time window immediately preceding the notification. |
stats.last |
Last value reported within the checking time window immediately preceding the notification.
Note: This value is appended to the output of
hostsFailingMessage, which is automatically included in the built-in email and PagerDuty alert targets. |
stats.min |
Minimum value reported within the checking time window immediately preceding the notification. |
stats.max |
Maximum value reported within the checking time window immediately preceding the notification. |
stats.mean |
Average of the values reported within the checking time window immediately preceding the notification. |
Example: Accessing Alert-Series Statistics in a Generic Webhook Alert Target Template
This portion of the Generic Webhook alert target template shows how to use the failingAlertSeries iterator to retrieve alert-series statistics for each time series that failed:
Example: Alert-Series Statistics in Output from the Sample Template
The preceding template might yield the following message:
List All Sources and Point Tags of an Aggregation Alert’s Time Series
Starting with the 2023.31 release, you can use the contributingKVs iterator to visit each source and point tag (shown as a <key>=<value> pair) of a failed alert whose condition uses a single top-level aggregation function. For example, the condition of the failed alert can be sum(ts(~sample.cpu.usage.percentage)) > 1.
| Iterator | Definition |
|---|---|
contributingKVs |
This iterator is populated only when there is no data in the failingAlertSeries iterator. This happens when the alert condition uses a single top-level aggregation function.
This iterator returns the keys and values of each source and point tag used in the alert's time series generating the aggregation. The sources and point tags listed might or might not be a part of the actual failing time series. The aggregation can contain thousands of keys but the display is limited to 100 which is configurable. |
Example: Accessing All Sources and Point Tags in a Generic Webhook Alert Target Template
This portion of the Generic Webhook alert target template shows the iterator that returns the keys and values of the time series used in a failed alert whose condition uses a single top-level aggregation function:
Example: All Sources and Point Tags in Output from the Sample Template
Here is a sample keys and values output generated with the preceding template:
Tailor Content to the Trigger Type
If you want to send out different notifications for different types of triggers, you can use the following functions. For example, you can use the same template to send out one message for a firing alert, and another message for an updated alert. You also tailor content based on the alert severity.
| Function | Definition |
|---|---|
isAlertOpened |
Includes the contents of the section only if the alert has transitioned from checking to firing. |
isAlertUpdated |
Includes the contents of the section only if the alert is updated - that is, if the alert continues firing while an individual time series changes from recovered to failing, or from failing to recovered. |
isAlertResolved |
Includes the contents of the section only if the alert is fully resolved, and so has transitioned from firing to checking. |
isAlertMaintenance |
Includes the contents of the section only if one or more sources associated with the alert are in an ongoing maintenance window. |
isAlertSnoozed |
Includes the contents of the section only if the alert has been snoozed. |
isAlertRetriggered |
Includes the content of this section if Resend Notification is set for this alert, and if the notification is not an initial notification but a resend. |
isAlertNoData |
Includes the content of this section if the alert query returns NO DATA. |
isAlertNoDataResolved |
Includes the contents of the section only if the alert previously returned NO DATA, and so has data now. |
severityInfo |
Includes the contents of the section only if alert severity is set to INFO. |
severitySmoke |
Includes the contents of the section only if alert severity is set to SMOKE. |
severitySevere |
Includes the contents of the section only if alert severity is set to SEVERE. |
severityWarn |
Includes the contents of the section only if alert severity is set to WARN. |
Example: Conditionalizing Content in a Plain Text Alert Target Template
Here is an alert target template for plain text notifications that sends the text “Alert is firing!” if the alert opened, and sends different messages if the alert is updated or resolved.
Here is the output in a notification that was triggered by the alert firing.
Limit List Sizes
If your messaging platform imposes a limit on the number of characters in a notification, you can avoid exceeding this limit by setting a limit on the number of items returned by iterators.
The default value for each limit you can set with a customization function is 500. You must set the limit before iteration or the limit does not take effect.
The order of the limit settings determines limit precedence. For example, if you first set setDefaultIterationLimit and then you set setFailingLimit, then setFailingLimit overwrites the setDefaultIterationLimit setting.
The failingLimit property applies to all iterators in the failing category: failingAlertSeries, failingSeries, failingHosts, and failingHostsToSourceTags.
See Example: Setting and Testing Iteration Limits below for an example.
failingHosts), you can retrieve the alertId from the notification and use the REST API to get the full list of items.| Function | Definition |
|---|---|
iterationLimitExceed |
Checks whether the number of the result returned is limited by an iteration limit. Valid values are: failingLimitExceed, inMaintenanceLimitExceed, newlyFailingLimitExceed, and recoveredLimitExceed.
|
setDefaultIterationLimit |
Sets all limits to the same value. |
setFilterByKVsLimit |
Sets the limit for the number of items returned by filterByKVs.
|
setRecoveredLimit |
Sets the limit for the number of items returned by recoveredAlertSeries, recoveredHosts, and recoveredSeries.
|
setInMaintenanceLimit |
Sets the limit for the number of items returned by inMaintenanceAlertSeries, inMaintenanceHosts, and inMaintenanceSeries.
|
setNewlyFailingLimit |
Sets the limit for the number of items returned by newlyFailingAlertSeries, newlyFailingHosts, and newlyFailingSeries.
|
setContributingKVsLimit |
Sets the limit for the number of items returned by contributingKVs.
|
Example: Setting and Testing Iteration Limits
Suppose you have 8 failing sources: source1, source2, source3, source4, source5, source6, source7, source8. You set setDefaultIterationLimit to 5 in the first line of the following template:
The template with these settings produces the following output for the 8 failing sources:
failingHosts iterates only up to failingLimit, which is 5 in this case. failingLimitExceed is true because the number of failing sources exceeds the limit.
In contrast, if the failingLimit is 10, the output is the following for 8 failing sources:
For this case (limit 10, failing sources 8) failingLimitExceed is false because the number of failing sources does not exceed the limit set.
Utility Functions for Readability
You can use alert target utility functions to make the output of the alert target more readable. This section doesn’t include examples, but many other examples include these functions.
- Use
jsonEscapeif you send notifications to a messaging platform that uses JSON. - Use
xml11Escapeorxml10Escapeif you send notifications to a messaging platform that uses XML. - Use
trimTrailingCommaif you send notifications to a messaging platform that does not automatically suppress a literal comma after the final element of a list. - Use
convertWhiteSpaceto convert characters that cause problems in a JSON file (\t\n\x0B\f\retc.) to white space. - Use
convertEpochMillisToSecondsto convert Epoch milliseconds to seconds. This is useful if you want to create an alert target that includes a URL, which can’t include milliseconds.
| Function | Definition | Example |
|---|---|---|
jsonEscape |
Escapes the characters in a string using JSON string rules.
Escapes any values it finds into their Json string form. Deals correctly with quotes and control-chars (tab, backslash, cr, ff, etc) so, for example, a tab becomes the characters \\ and t. |
Input: She didn't say, "Alert!"Output: She didn't say, \"Alert!\" |
xml11Escape |
Escapes the characters in a String using XML entities.
XML 1.1 can represent certain control characters, but it cannot represent the null byte or unpaired Unicode surrogate codepoints, even after escaping.
escapeXml11 removes characters that do not fit in the following ranges:[#x1-#xD7FF]|[#xE000-#xFFFD]|[#x10000-#x10FFFF]
escapeXml11 escapes characters in the following ranges:
[#x1-#x8]|[#xB-#xC]|[#xE-#x1F]|[#x7F-#x84]|[#x86-#x9F]
|
Input: "bread" & "chocolate"Output: "bread" & "chocolate" |
xml10Escape |
Escapes the characters in a string using XML entities.
XML 1.0 is a text-only format, it cannot represent control characters or unpaired Unicode surrogate codepoints, even after escaping.
escapeXml10 removes characters that do not fit in the following ranges:
#x9|#xA|#xD|[#x20-#xD7FF]|[#xE000-#xFFFD]|[#x10000-#x10FFFF]
escapeXml10 escapes characters in the following ranges:
[#x7F-#x84]|[#x86-#x9F] |
Input: "bread" & "chocolate"Output: "bread" & "chocolate" |
trimTrailingComma
|
Retains the string content up to the last comma. Often used within iterator sections to remove the extra comma after the last element visited by an iterator. |
Input:"(Host: "xyz", Label: 3.0), "Output: "(Host: "xyz", Label: 3.0) "
|
convertWhiteSpace
|
Converts characters that cause problems in a JSON file (\t \n \x0B \f \r etc.) to white space.
|
Input:Give me space! \r Now!Output: Give me space! Now! |
convertEpochMillisToSeconds
|
Convert Epoch milliseconds to seconds. This is useful if you want to create an alert target that includes a URL. URLs can’t include milliseconds. | Input:1600273622000 Output:1600273622 |
Include a Link to a Tracing Service Dashboard
If the query in an alert has an application and service name and meets a specific alert target, you get a link to drill down to the service dashboard. The service dashboard lets you see RED metrics of the application or service and identify potential hot spots.
tracingDashboardLinks value is shown in the Alerts Browser. In contrast, the alertTriageDashboardLinks values are shown in the alert notification if specified as part of the alert. See Information About Alert Resolution HelpLet’s walk through a scenario:
-
Create an alert target. Let’s use the Generic Webhook alert target template because it includes the required settings by default:
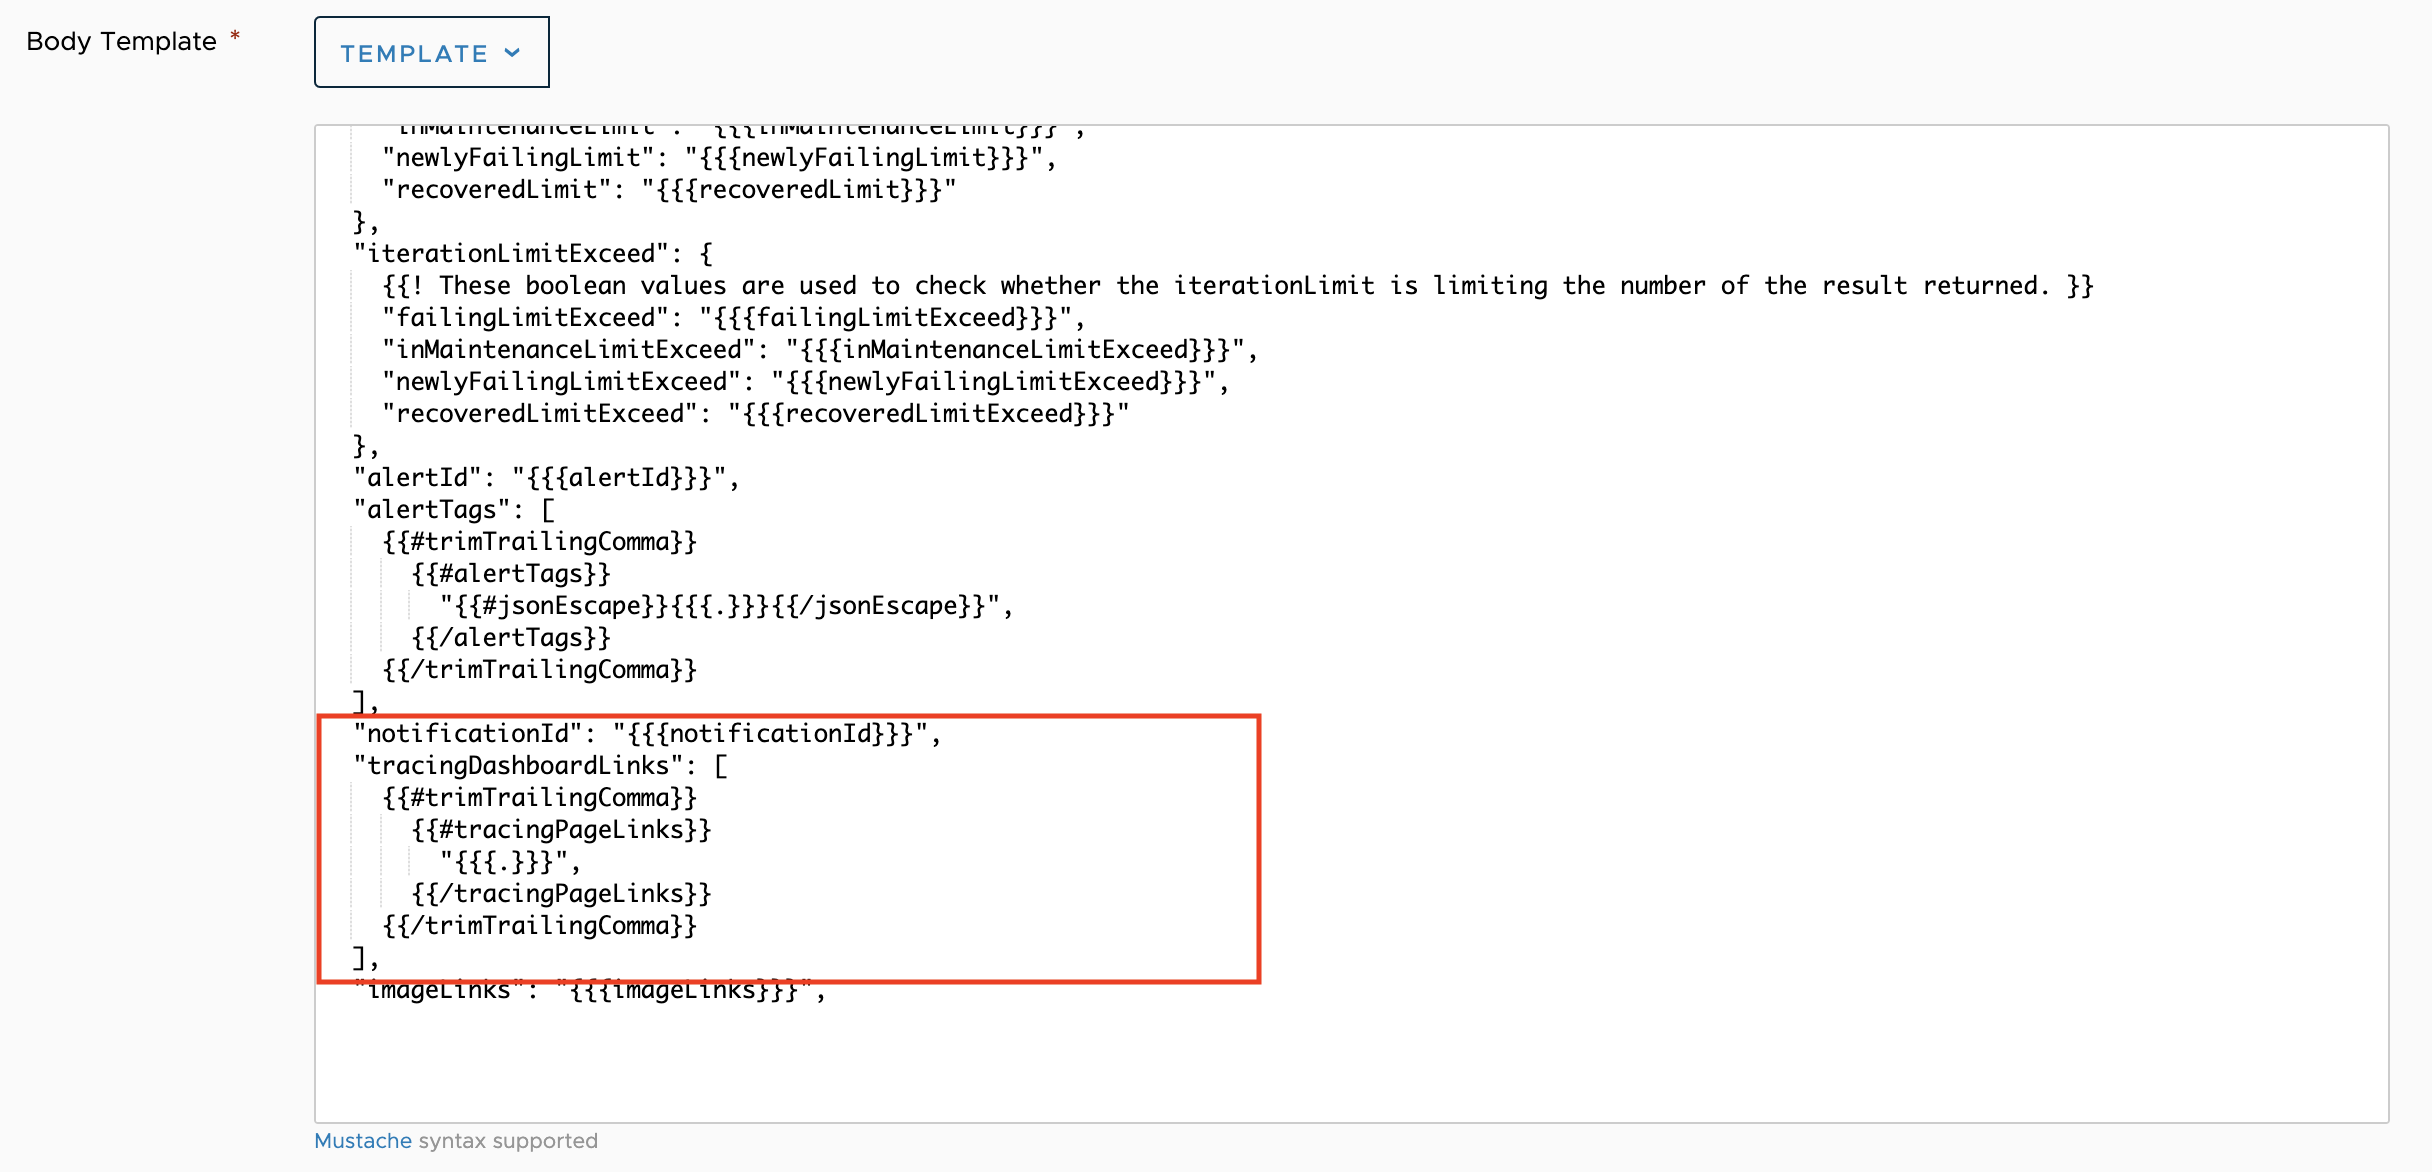 Note: If you want to include a service dashboard link in a Slack notification, email, or Pager Duty notification, you need to copy the code snippet below and add it to the respective template.
"tracingDashboardLinks": [ {{#trimTrailingComma}} {{#tracingPageLinks}} "{{{.}}}", {{/tracingPageLinks}} -
Create an alert that would fire for a specific application or service and set the alert target you created. Here we create an alert that fires when the request rate is greater than 3 for the
beachshirtsapplication’sdeliveryservice.
If the alert you created moves to the firing stage, we send a notification to the users specified in the alert target. The notification includes a link to the service dashboard. For example, in this scenario, the JSON output of your notification looks like this:
"tracingDashboardLinks": [
  "https://<cluster_name>.wavefront.com/tracing/service/details#_v01(g:(d:1500,s:1619576595),p:(application:(v:beachshirts),service:(v:delivery)))"
]
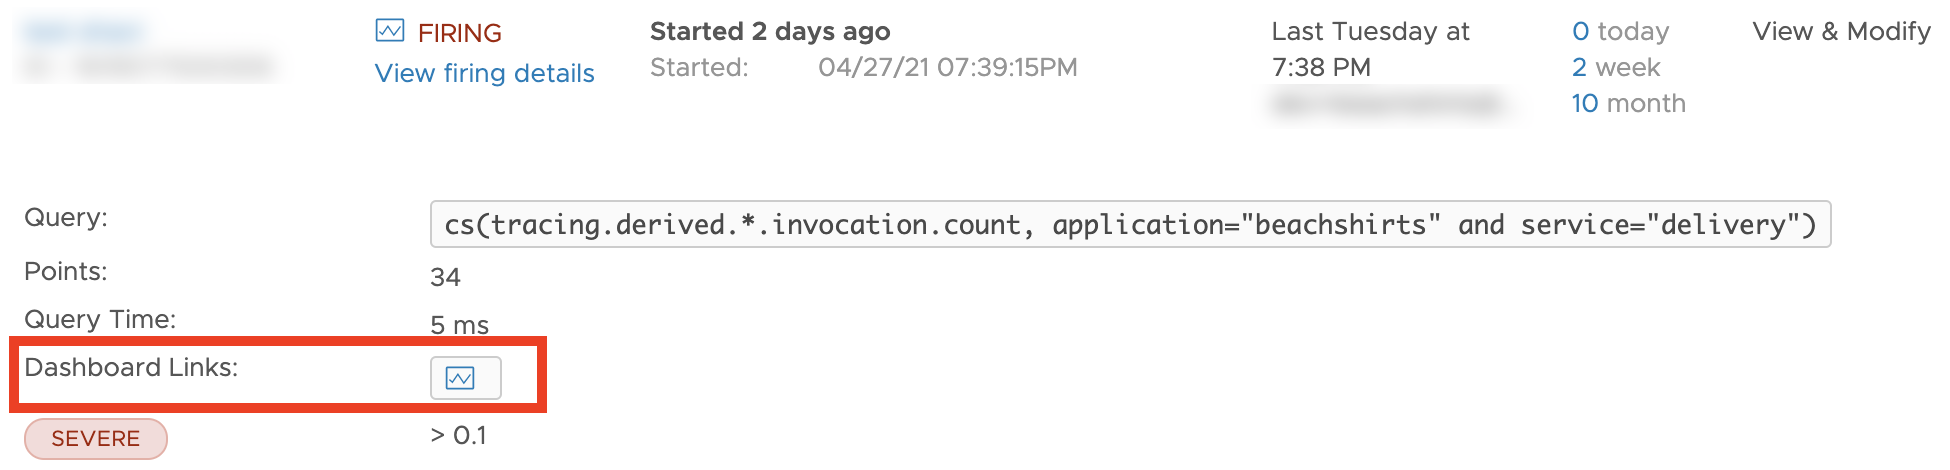
The link takes you to the service dashboard of the beachshirts application’s delivery service.
You also see the dashboard link in the alert. Click on the image icon to go to the service dashboard of the beachshirts application’s delivery service.