VMware Aria Operations for Applications (formerly known as Tanzu Observability by Wavefront) log integration lets you drill down from time series that is displayed in a chart to a log entry in a logging system such as Scalyr, ELK, or Splunk.
Suppose while analyzing metrics data you find an anomaly such as an unexpected drop in transaction rate. You want to look at corresponding log entries. Set up the Log Integration and you
- Look at the problem in a chart
- Click through from the time series directly to a related entry in your logging system.
Create a Log Integration
Users with External Links permission can create and modify log integration.
- Select Browse > Create Log Integration.
- Specify a link name and description.
-
(Optional) Specify a filter to limit the log integration from showing on a time series. For example, if you specify a point tag filter of
env=production, you will only see the specified log integration when you right click on a time series that has data related to that point tag.Filters are optional but allow you to show the external link only on certain time series.
Type Description Example Metric Filter Regex Regular expression that metric names must match. jvm.memory.heap\w+ Source Filter Regex Regular expression that source names must match. co-2a-app[0-9]+-i-\d+ Point Tag Filter Regexes Point tag key and a regular expression that point tag values must match. Click the plus sign after you specify the regex. Tag Key=env
Filter Regex=prod\w+The following screenshot shows an example that specifies all three types of filters.

- Specify the Link URL template.
The link URL template uses Mustache syntax. The template supports the following properties:
Property Description source Source of the series. startEpochMillis Start time of the chart window, in Epoch time. endEpochMillis End time of the chart window, in Epoch time. <pointTagName1>, <pointTagName2>,... One or more point tag names associated with the series. -
You can apply functions to transform the URL. All functions begin with the namespace
functions.Function Description urlEncode URL Encoder epochMillisToEpochSeconds Converts epoch milliseconds to epoch seconds. epochMillisToISO Converts epoch milliseconds to an ISO8601 representation. epochMillisEra,epochMilliscenturyOfEra, epochMillisyearOfEra,epochMillisYearOfCentury, epochMillisYear,epochMillisMonthOfYear, epochMillisDayOfYear,epochMillisDayOfMonth, epochMillisWeekyear,epochMillisWeekOfWeekyear, epochMillisDayOfWeek,epochMillisHalfDayOfDay, epochMillisClockHourOfHalfday,epochMillisClockHourOfDay, epochMillisHourOfHalfday,epochMillisHourOfDay, epochMillisMinuteOfDay,epochMillisMinuteOfHour, epochMillisSecondOfDay,epochMillisSecondOfMinute, epochMillisMillisOfDay,epochMillisMillisOfSecond 0 for BC, 1 for AD. See Joda-Time - Java date and time API.
- Here's the simplest possible example, directing you to the
example.comdomain.https://example.com/{{source}} - The following external link URL template goes to
scalyr.comand passes in the source of the series and the start and end time of the chart if a user right-clicks on a series.https://www.scalyr.com/events?logSource={{{source}}}&startTime={{startEpochMillis}}&endTime={{endEpochMillis}} - The next external link URL template looks for a service trace in the distributed traces.
https://demo.wavefront.com/tracing/service/{{namespace_name}}/{{container_name}}#_v01(g:(d:7200,ls:!t,s:{{#functions.epochMillisToEpochSeconds}}{{startEpochMillis}}{{/functions.epochMillisToEpochSeconds}},e:{{#functions.epochMillisToEpochSeconds}}{{endEpochMillis}}{{/functions.epochMillisToEpochSeconds}}),p:(cluster:(v:'*'),shard:(v:'*'),source:(v:'*'))) - The following external link URL template displays an event on the Events page when you click the event in a chart. Replace
<my_instance>with the name of your product instance.https://<my_instance>.wavefront.com/events?search=%7B%22searchTerms%22%3A%5B%7B%22type%22%3A%22freetext%22%2C%22value%22%3A%22{{alertId}}%22%7D%5D%2C%22sortOrder%22%3A%22ascending%22%2C%22sortField%22%3Anull%2C%22pageNum%22%3A1%2C%22cursor%22%3A%22%22%2C%22direction%22%3A%22forward%22%2C%22timeRange%22%3A%7B%22start%22%3A{{startEpochMillis}}%2C%22quickTime%22%3Anull%2C%22end%22%3A{{endEpochMillis}}%7D%7D&tagPathTree=%7B%7D - The following external link URL template references the point tag name
service:http://<hostname>?time:(from:'{{#functions.epochMillisToISO}}{{startEpochMillis}}{{/functions.epochMillisToISO}}',to:'{{#functions.epochMillisToISO}}{{endEpochMillis}}{{/functions.epochMillisToISO}}'))&{{#functions.urlEncode}}host:{{source}} AND source:"/mnt/logs/{{service}}.log"{{/functions.urlEncode}}'))
- Click Save.
Navigate to External Logs
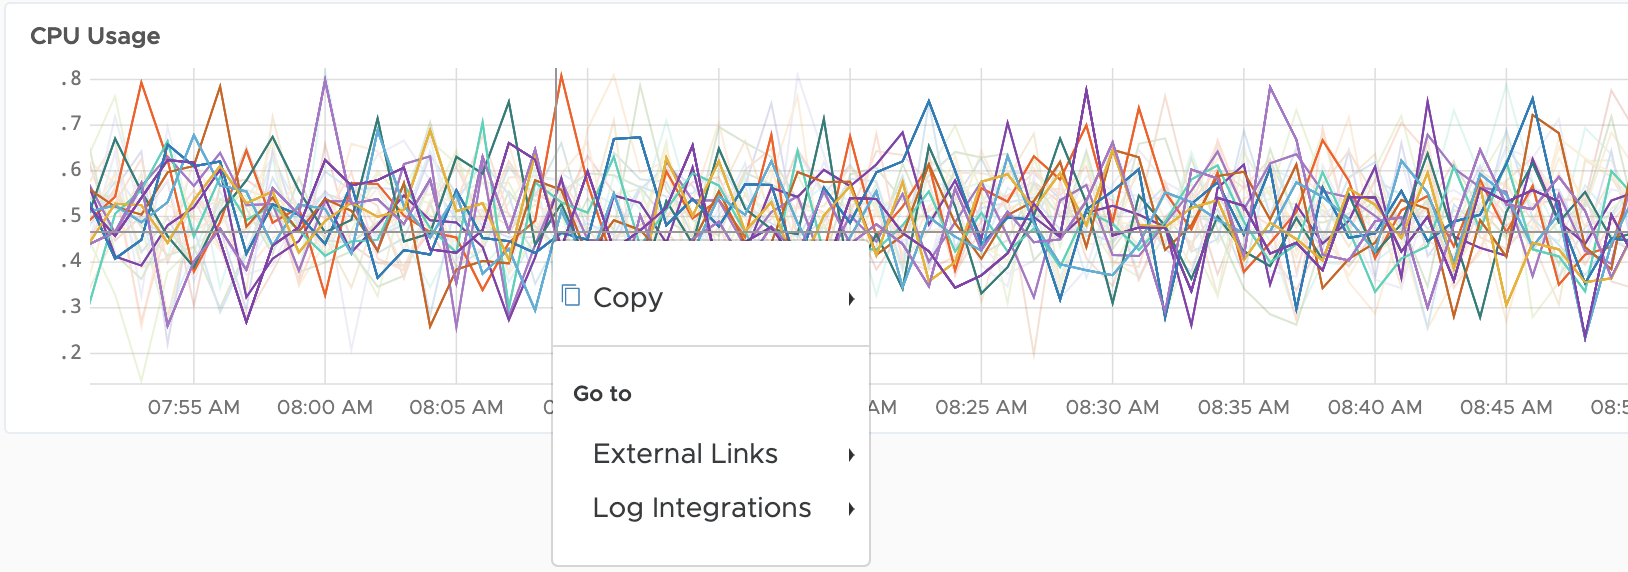
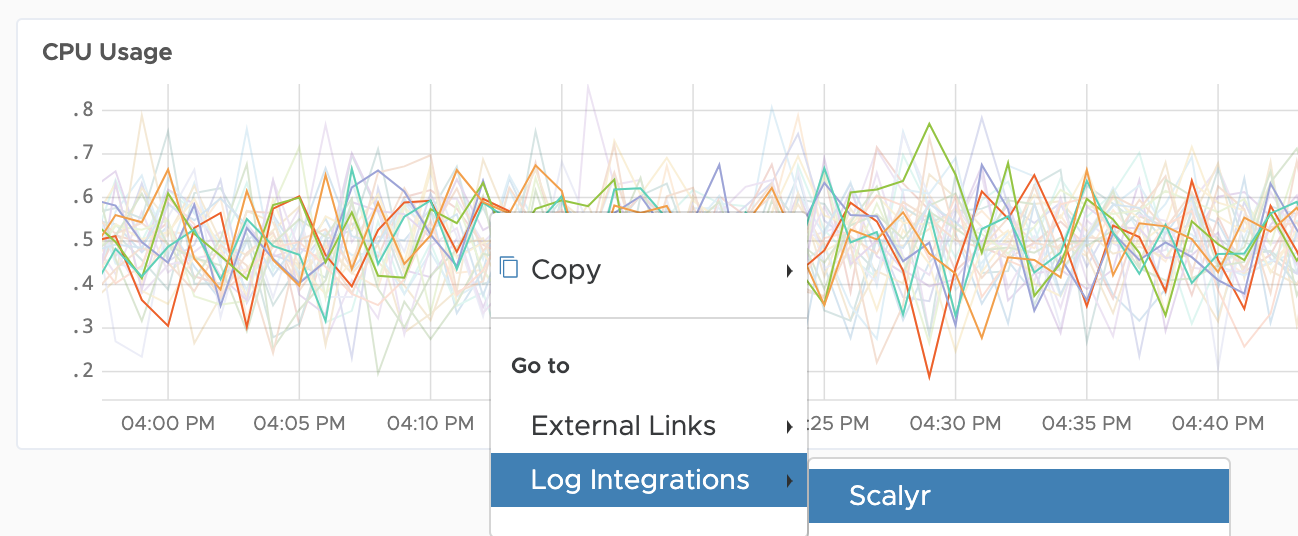
After the log integration has been set up, users can use the right-click menu on a time series to navigate to a log integration.
- By default, log integrations show up on all the time series.
- If you specify a filter, the Log Integration menu only shows up on the specified time series.
To navigate to a log integration:
- Right-click a series.
-
Select Log Integration > <name>, where <name> is the name specified when the log integration was created.
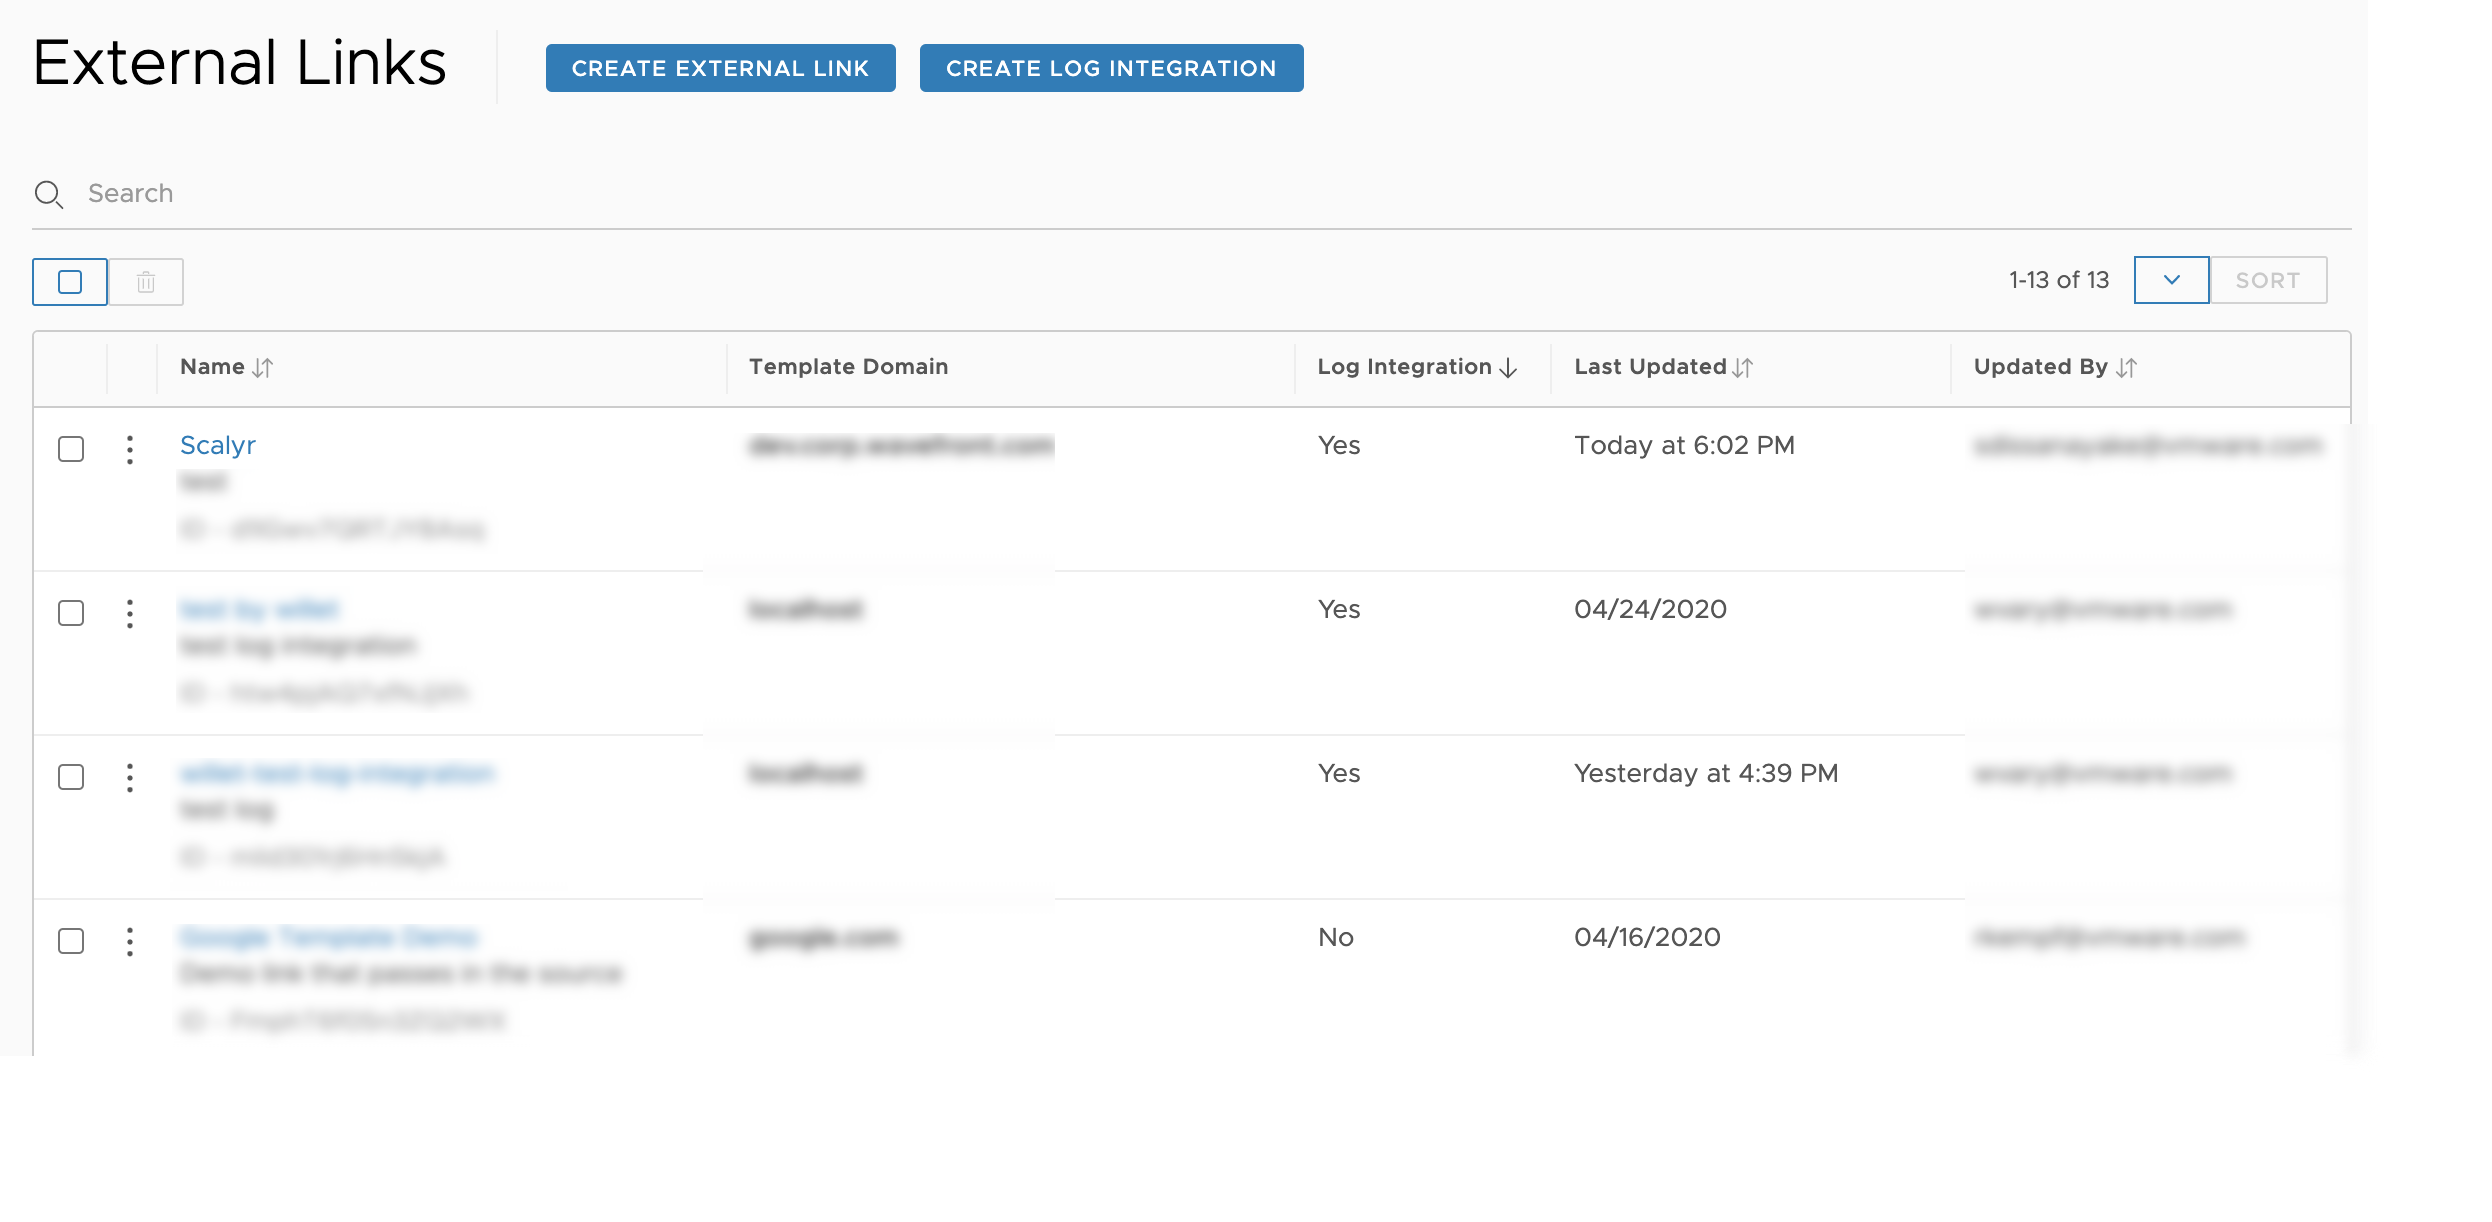
Manage Log Integrations
To update or delete a log integration, click Browse > External Links. This page lists all the log integrations and external links you have created.