Summary
hs(<hsMetricName> [and|or [not] <hsMetricName2>] ...
  [,|and|or [not] source="<sourceName>"] ...
  [and|or [not] tag="<sourceTag>"] ...
  [and|or [not] <pointTagKey>="<pointTagValue>"] ...)
Returns the series of histogram distributions that match the specified histogram metric name, optionally filtered by sources and point tags.
In a time-series chart, hs() displays just the median values of the distributions.
Parameters
| Parameter | Description |
|---|---|
| <hsMetricName> | Name of a histogram metric that describes one or more series of histogram distributions. Specify multiple histogram metric names by including wildcards or by combining multiple names with Boolean operators.
The extension of a histogram metric name (.m, .h, or .d) indicates whether a series has one histogram distribution per minute, hour, or day, as determined by the histogram aggregation interval. For example: users.settings.numberOfTokens.m |
| source="<sourceName>" | Source of the hsMetricName distributions to be returned. Distributions from any other sources are filtered out of the result set. Specify any number of sources by combining them with Boolean operators. Omit this parameter to return hsMetricName distributions from all sources. |
| tag="<sourceTagName>" | Source tag that designates the sources of the hsMetricName distributions to be returned. Distributions from any sources without the source tag are filtered out of the result set. Specify any number of source tags by combining them with Boolean operators. Omit this parameter to ignore source tags. |
| <pointTagKey>="<pointTagValue>" | Point tag key and value that are associated with the hsMetricName distributions to be returned. Distributions without the specified key-value pair are filtered out of the result set. Specify any number of point tags by combining them with Boolean operators. Omit this parameter to ignore point tags. |
Description
The hs() histogram function returns one or more histogram series, where each histogram series is a sequence of histogram distributions that Wavefront has computed from the data points of a time series. Every distribution in a histogram series is computed from the points that occur in a particular time interval. All distributions in an ingested histogram series occur once a minute, once an hour, or once a day.
The hs() function uses the specified parameters to select the histogram series to return:
-
Specify just the histogram metric name to return all histogram series that match the name. For example, the following function returns all histogram series for
user.settings.numberOfApiTokens.m, which might be emitted from multiple sources and have any number of point tags associated with them:hs(users.settings.numberOfApiTokens.m) -
Filter the matched series by specifying a combination of source names, source tags, or point tags. For example, the following function returns only the histogram series that are from the source
host1and have acustomerpoint tag with the valueqa:hs(users.settings.numberOfApiTokens.m, source="host1" and customer="qa")
You typically use hs() as an input hsExpression that you specify to another histogram query function, for example, max(hs(users.settings.numberOfApiTokens.m))
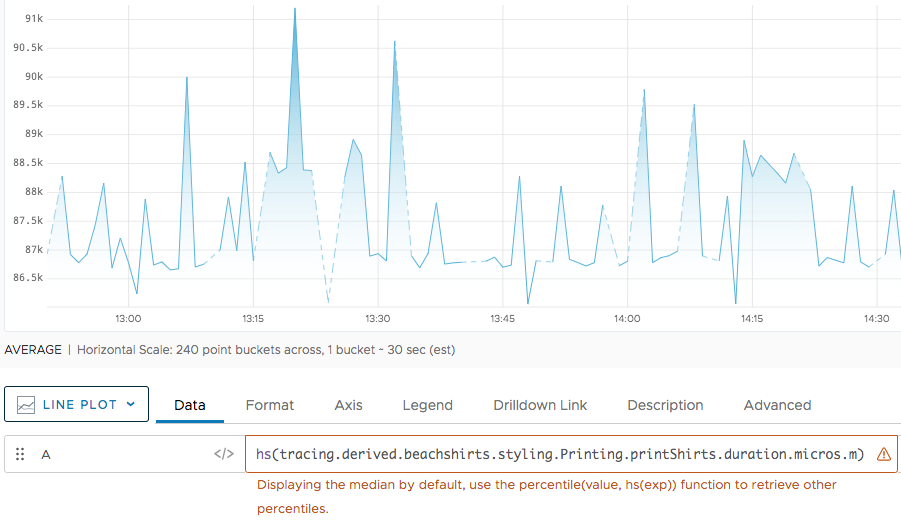
You can visualize hs() by running it as a top-level query under a time-series chart. Doing so displays a time series consisting of just the median values from the distributions in each returned histogram series. The chart for hs(my.hsMetric.m) is the same as the chart for median(hs(my.hsMetric.m)).
Examples
In the following example, we run hs() as a top-level query to display a histogram metric in a histogram chart. The histogram chart allows exploration of the histogram metrics, in part via hover text.

It’s also possible to use the query with a time-series chart. This line chart displays the results as a time series of the median values from the returned distributions.
