Summary
next([<timeWindow>,] <tsExpression>)
Fills in gaps in each time series described by tsExpression, by inserting data points that have the next known value of the time series.
Specify timeWindow to fill in data for a limited period of time before each existing point.
Parameters
| Parameter | Description |
|---|---|
| timeWindow | Maximum amount of time to fill with inserted data points. If you omit this parameter, gaps with duration of up to the metrics obsolescence period are completely filled.
You can specify a time measurement based on the clock or calendar (1s, 1m, 1h, 1d, 1w), the window length (1vw) of the chart, or the bucket size (1bw) of the chart. Default is minutes if the unit is not specified. |
| tsExpression | Expression that describes the time series in which to replace data gaps with the next value. |
Description
The next() function allows you to assign the next known reported data point value to a gap of missing data. If there’s a gap, nothing happens until the first new value becomes available. Then the data is backfilled with that, the next, value. No line (dotted or solid) is drawn until the next data point is reported.
By default, next() applies the next reported data value to gaps of missing data with duration of up to the metrics obsolescence period. If you’d like this window to be smaller, you can use the timeWindow parameter.
Examples
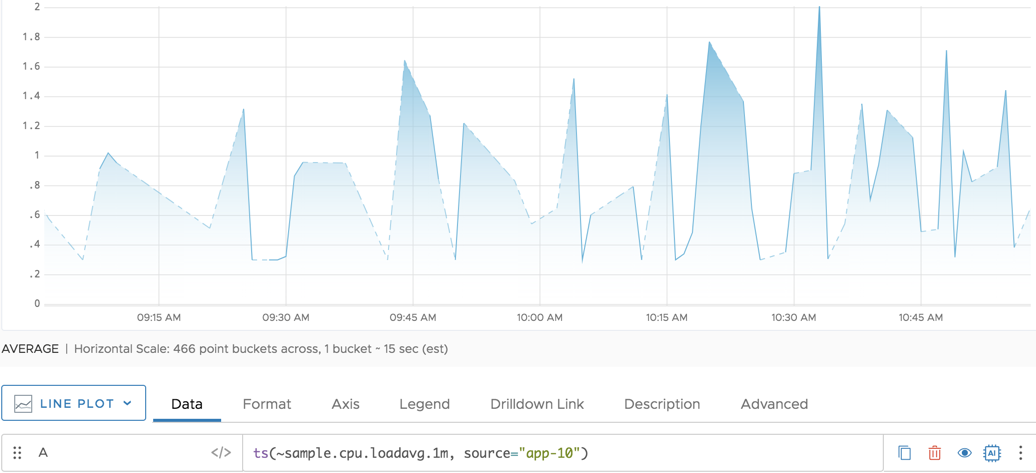
In the following example, we’ve zoomed in on ~sample.cpu.loadavg.1m and see missing data.
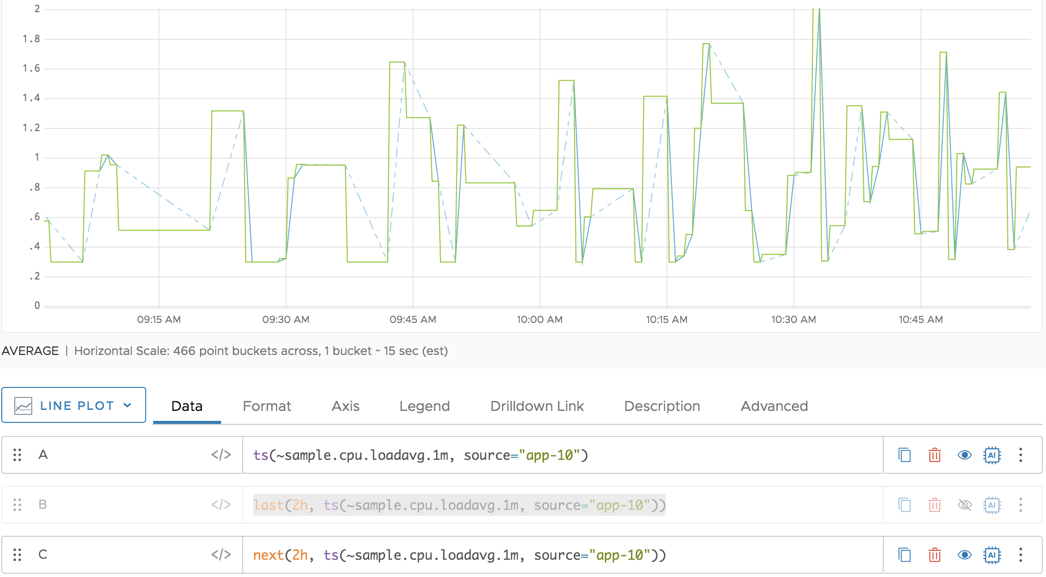
We decide to replace the missing data with the last value before the gap, in this case 0.

Then we replace the missing data with the first good value after the gap using next.
Caveats
next() to a histogram. Even if you convert the histogram to a tsExpression, an error results if you then apply next().See Also
Using Moving and Tumbling Windows to Highlight trends
Other missing data functions include: