Summary
interpolate(<tsExpression>)
Fills in gaps in each time series described by tsExpression, by inserting a continuous linear interpolation of data points.
Parameters
| Parameter | Description |
|---|---|
| tsExpression | Expression that describes the time series in which to replace data gaps with interpolated data points. |
Description
The interpolate() function replaces a gap of missing data (dashed line) with a solid line. The value assigned to the new solid line depends on where the interpolation occurred in relation to the value on the y-axis.
For example, suppose there is a gap of missing data in between two reported point values of 2 and 1. The value assigned to that gap of missing data will be between 2 and 1, with the displayed value dependent on where it intersects the y-axis. When the query engine performs interpolation, it applies interpolate() to the first 85% of a chart window.
Examples
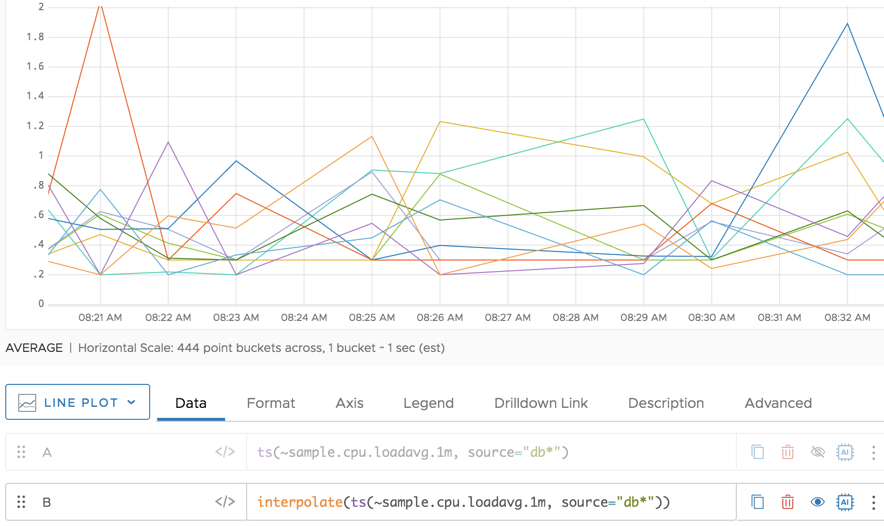
The following example zooms in on an area of a chart where data are missing. In charts, you’ll see dashed lines to indicate the missing data.
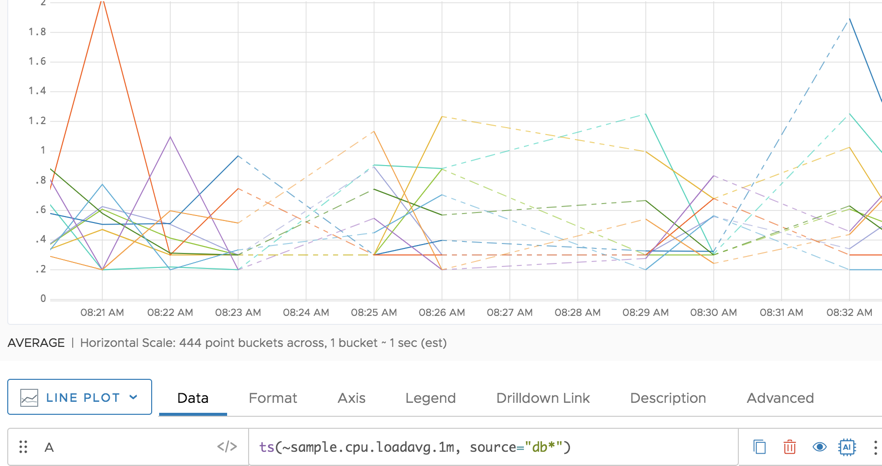
When you use interpolate() for this use case, the dashed lines are replaced with filled lines, indistinguishable from areas where data are available.
Caveats
interpolate() to a histogram. Even if you convert the histogram to a tsExpression, an error results if you then apply interpolate().See Also
Using Moving and Tumbling Windows to Highlight trends
Other missing data functions include: