If you’re migrating from v1 dashboards and charts to v2, you’ll find most of the changes intuitive. This page highlights new features and has some FAQs.
Main Improvements
Our revamped UI for charts and dashboards includes the following main features:
Create Dashboard Workflow
Simple workflow for dashboards with multiple charts.
|
 |
From Query Builder to Chart Builder
|
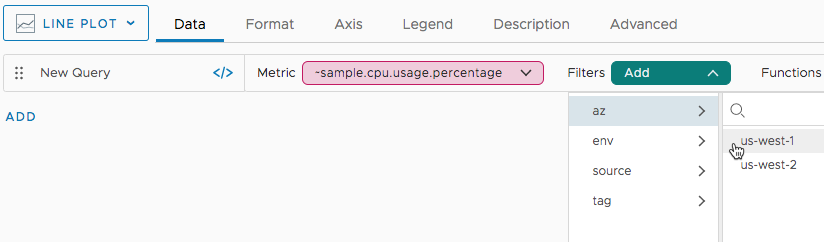
Complete redesign. Chart Builder helps you visualize exactly what you need. We support easy metric selection and intuitive grouping, filtering, and functions. Switch to Query Editor only for advanced tasks. |
 |
Integrated Chart Customization
| You can now specify the data you want to display in the Data tab and use other tabs for customization. | 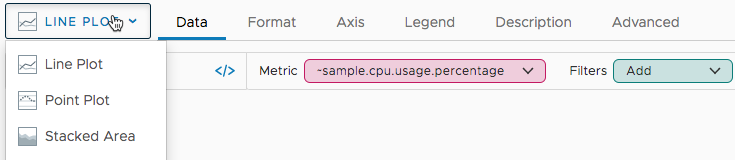 |
| We made usability improvements for each chart type - and you can use delete, clone, and create alert from the icon bar. | 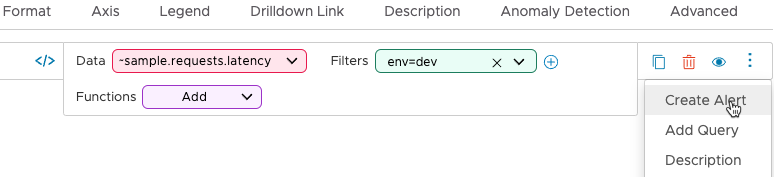 |
Dashboard Variables Redesign
Dashboard variables are now easier to configure and easier to use.
| We've streamlined variable configuration for developers. We've made setting variables easier for all users. | 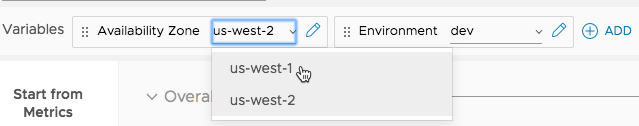 |
Chart FAQs from v2 Users
Q: How do I add an alert from a chart?
A: Open the chart, click the Data tab, click the ellipsis icon next to the query, and select Create Alert.
Q: Some of my charts look different. What can I do?
A: The goal of this UI revision is parity, but we’ve made a few changes:
- Scatter plots are obsolete. Change scatter plot to a different chart type before you go to v2.
-
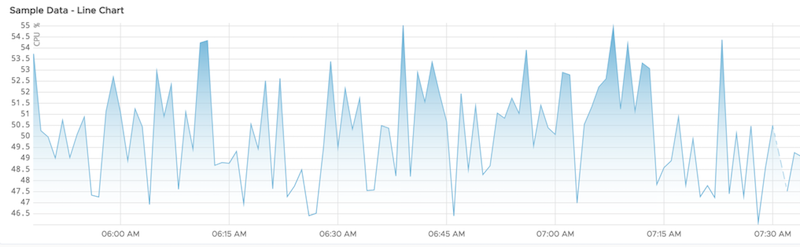
Line plots changed. Single-line line plots now use highlighting to make the highs and lows stand out more:
Line plots with more than one line look similar to v1 line plots though the colors are different.
- Single Stats charts with sparklines have a changed look. You can experiment with sparkline position by selecting Sparkline > Show Sparkline. Change Minimum to 0 for a chart that looks like the v1 chart.
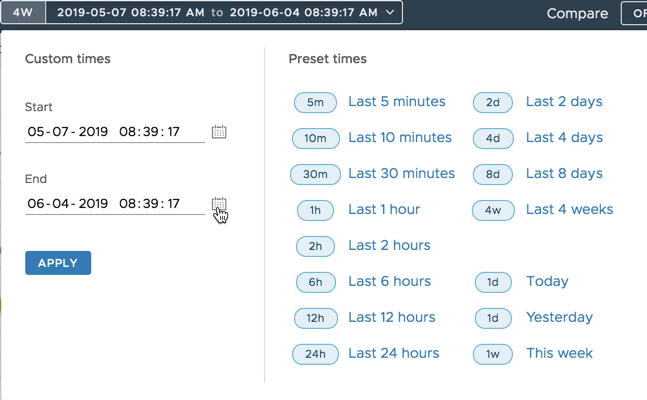
Q: How does the new time window selector work?
A: Our new time window selector supports a selection of preset times, or you can specify a custom time frame. 4 weeks is not the same as 1 month – use the custom time window selector to select a full month.
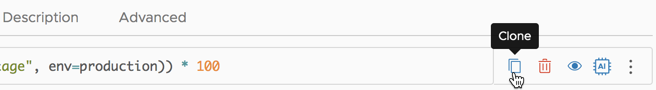
Q: How do I clone or delete a chart?
A: Open the chart and on the Data tab, click the Delete or Clone icon on the right of the query.
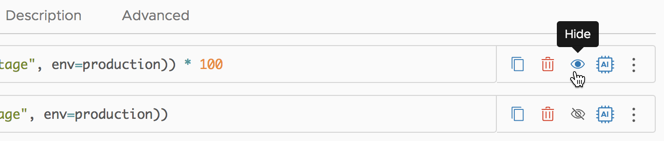
Q: How can I deselect (hide) a query?
A: Use the eye icon on the right of the query to hide or show the results of a query in the chart.
Q: How can I copy/paste table chart content in v2?
A: We’re working on improving the copy/paste behavior. For now, please use the third-party CLI to generate a CSV file. See our blog about using the CLI .
Q: How can I create an embedded chart in v2?
A: Embedded charts allow you to make a chart available in a different context, for example, on a Web page.
- All embedded charts created in v1 will continue to work.
- You can create new embedded charts for many chart types. However, those charts will render using v1 styling. We’re in the process of finalizing embedded chart creation for all chart types with a v2 look and feel.
Dashboard FAQs from v2 UI Users
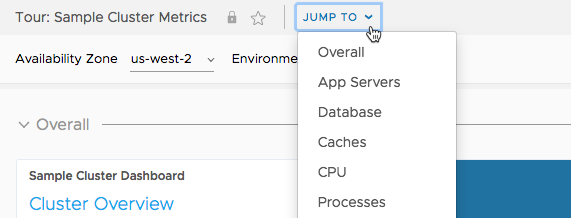
Q: Where are my sections?
A: Use the Jump To menu to select a section.
Q: Where’s the wrench icon (Dashboard display preferences)?
A: We’ve consolidated the UI for customizing dashboards.
- Select Edit.
- Click Settings in the top right.
- Set your preferences for the dashboard, click Accept, and click Save to save the dashboard and your preferences.

Q: Several of my charts now have warnings. What’s going on?
A: We’ve moved the warning icon from the bottom right of a chart to the top left to make it more visible. Here’s an example with v2 on the left and the same chart in v1 on the right:

We currently don’t distinguish between warnings and info messages. For example, if a query specifies a time window but doesn’t specify d, m, s, etc., we default to m (minutes) and show a warning. Expect an update in an upcoming release.
Q: Dashboard variables have changed. Where do I find out more?
A: We have new documentation for dashboard variables.