These release notes give an overview of the changes for Release 2020-38.x of the VMware Aria Operations for Applications (previously known as Tanzu Observability by Wavefront) service.
Metrics Security
This release supports metrics security policy rules, which allow fine-grained access control for metrics. Users with Metrics permission can block or allow access:
- To metrics, optionally filtered by source and/or point tag
- Based on groups, roles, and/or individual users.
Sensitive data become invisible in dashboards/charts, alerts, and auto-complete.
- Dashboards and charts show a warning message if some or all metrics are protected by the metrics security policy.
- For alerts, administrators can set a Secure Metric Details check box that removes details from alert notifications.
Watch the video on the Metrics Security Policy page for an overview.
Self-Service SAML Setup
We now support self-service SAML SSO for ADFS, G-Suite, Okta, OneLogin, Workspace One Access and PingOne, and will soon support self-service for other providers. Until now, customers who wanted to use SAML SSO had to send a metadata file to Wavefront for the setup.
Tracing Features
Tracing UI New Features and Improvements
This release includes many new features and improvements to help you analyze your applications and grasp the data at a glance.
-
Application Map is now a GA release.
-
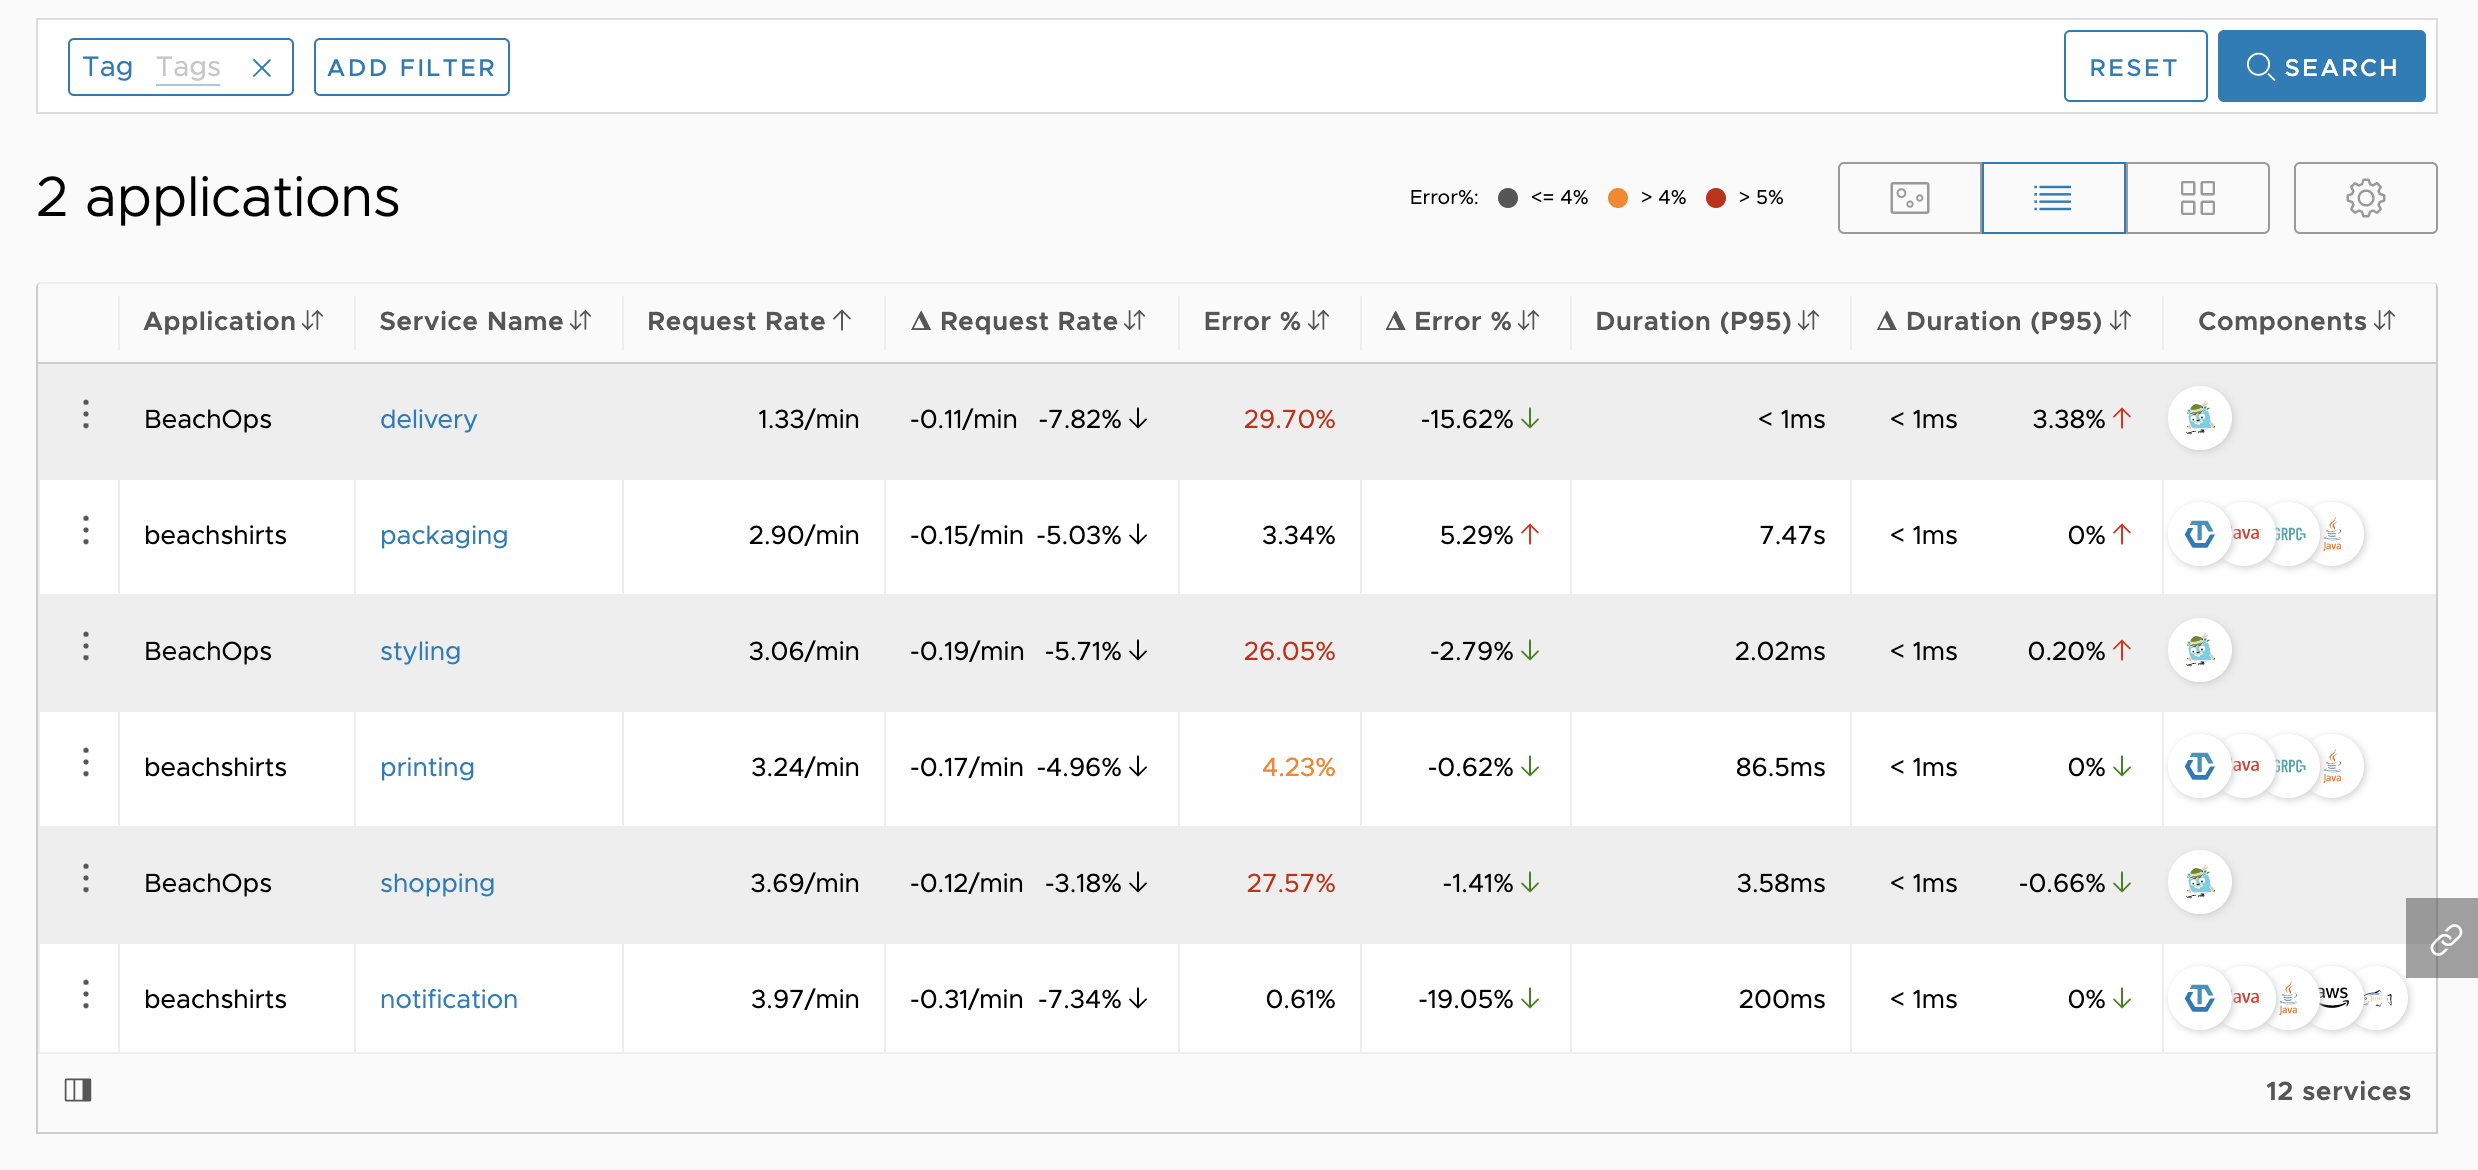
Table view (New) lists the applications and services in the form of a table. You can see the Request, Error, and Duration (RED) metrics at a glance and sort the data.
-
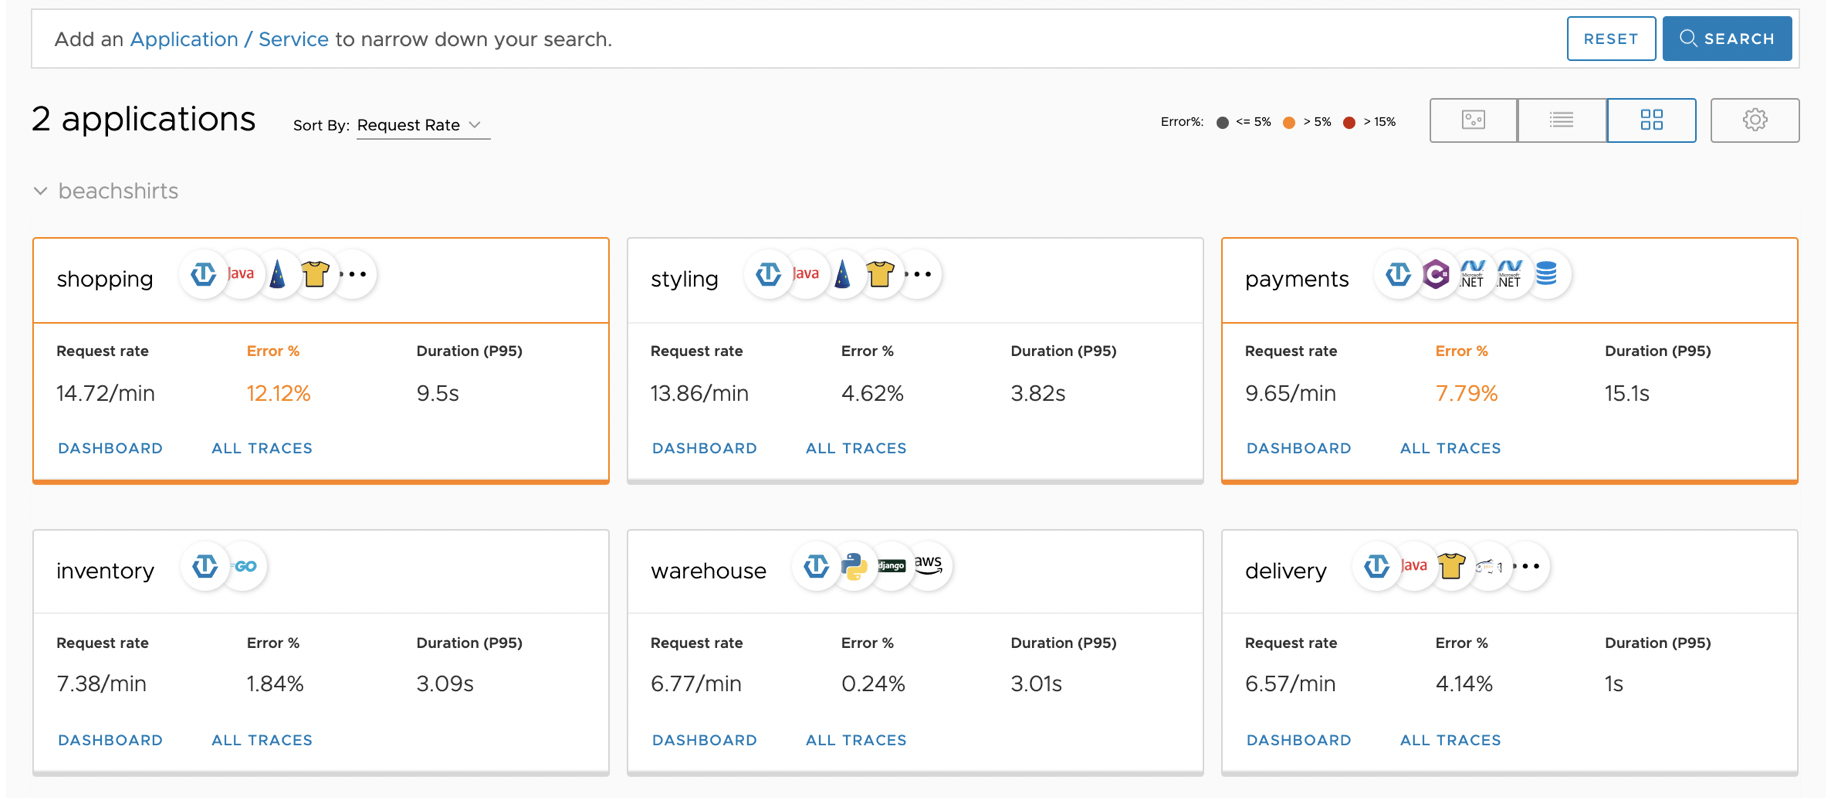
Grid view lists the application and services in a grid. You can see the RED metrics for each of the application’s services.
-
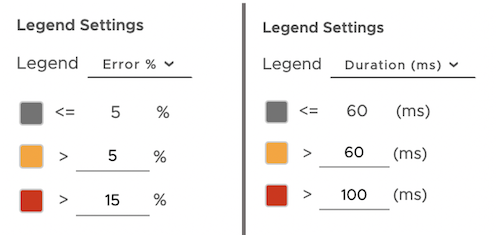
Customize the error% and duration legend settings of the application map, table view, and grid view. This is a user-level setting, and each user can customize it for their preference.
Export Traces and View Traces Offline
View traces offline by exporting traces and uploading them to Wavefront later on. See View Traces Offline for details.
|
 |
Tracing Critical Path Data in Charts
Critical Path data in charts help you view data trends and what’s going on faster.
- View tracing critical path data in charts as histogram metrics.
- Query critical path data using the
hs()function. See View Tracing Critical Path Data in Charts for details.
Delta Counters
Wavefront Spy
Enjoy in-depth exploration of what’s happening with delta counter metrics by using Wavefront Spy. We do not support exploration of delta counters in Wavefront Top yet.
UI Support for Delta Counters
Enhanced support for delta counters in all areas of the Wavefront UI:
| To query delta counter metrics, you can now select Delta Counters in Chart Builder. | 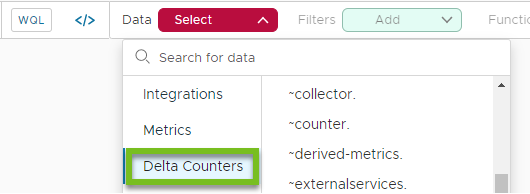 |
| To examine all delta counters in your environment, select Browse > Delta Counters. The process is the same as examining metrics in the Metrics Browser. | 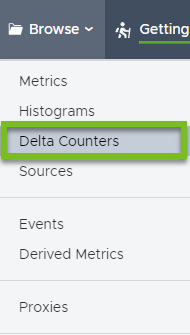 |
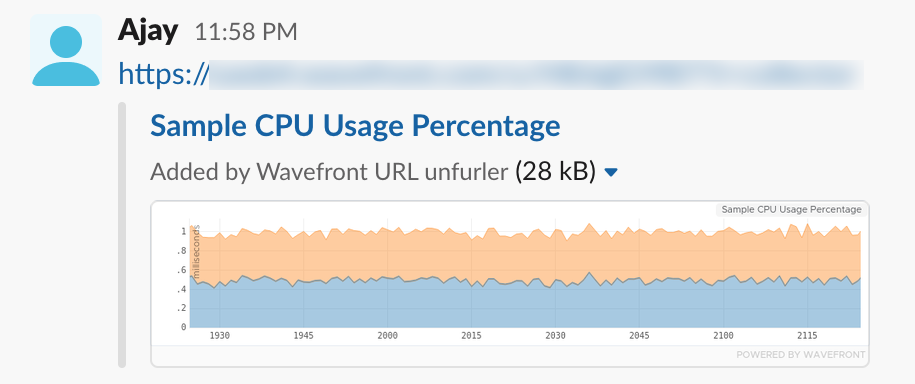
Chart Images in Slack
| Administrators can now add the Wavefront application to Slack. Afterwards, users who paste a link to a Wavefront instance are prompted whether they want to unfurl the link. An example is in the right column. This feature is only available if you're using Wavefront service 2020.38 or later. |
 |
Kubernetes Setup Improvements
The Kubernetes integration has been revamped. The new guided user experience:
- Provides streamlined instructions based on where you install the Kubernetes Metrics Collector
- Verifies you’ve configured the Kubernetes integration correctly during setup
- Shows the list of your Kubernetes clusters and their statuses in the integrations setup page

Miscellaneous Improvements
We made several other improvements to product and documentation:
- You can now conditionalize dashboard sections. This functionality is supported only through the dashboard JSON editor.
- Wavefront created their own Terraform provider. See the Terraform Registry and the Github repo.
- New
convertEpochMillisToSecondsMustache function is available for use with custom alert notifications. This conversion is useful if you want to create an alert target that includes a URL, which can’t include milliseconds. - New
dateTimeFormatMustache function is available for use with external links. The function takes an Epoch time and formats it according to the format specified informatusing Java’s joda Date Time Format. - New
.orElseoperator supports specifying a default value even if the time series did not report any values in the time window. See the default() function doc for details and examples.