Learn about the Oracle WebLogic Server Integration.

Oracle WebLogic Server

The Oracle WebLogic Server enables building and deploying Java Platform Enterprise Edition (Java EE) applications. The WebLogic Server infrastructure supports the deployment of many types of distributed applications.

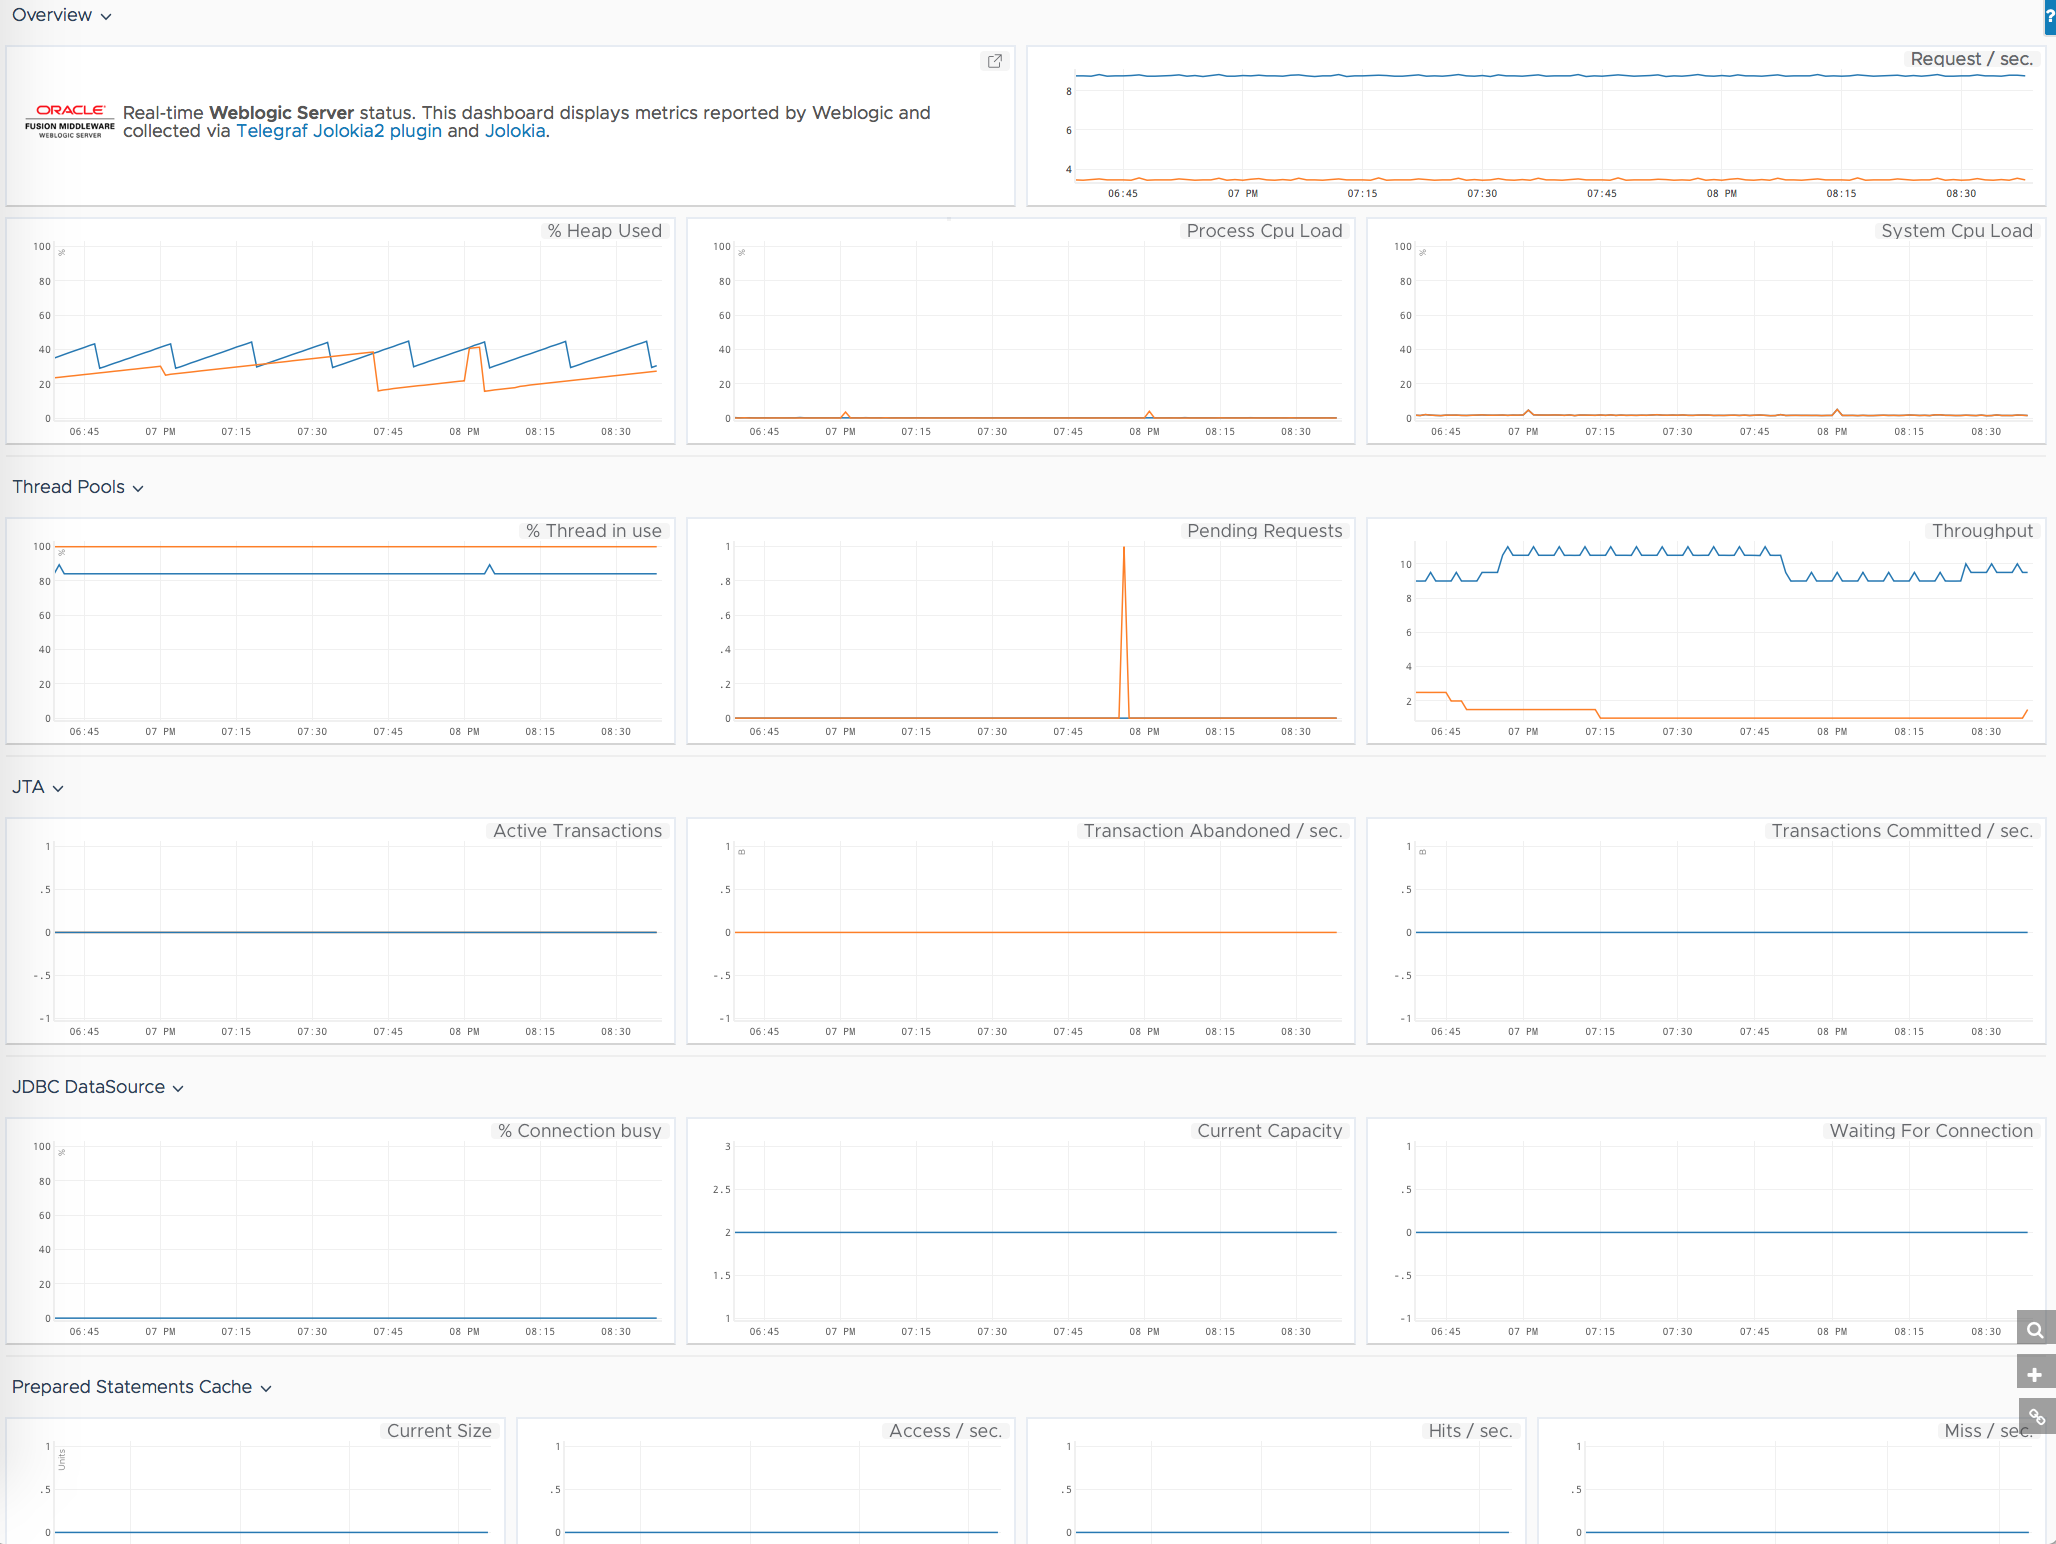
In addition to setting up the metrics flow, this integration also sets up a dashboard. images/weblogic-metrics.png

To see a list of the metrics for this integration, select the integration from https://github.com/influxdata/telegraf/tree/master/plugins/inputs.

WebLogic Server Setup

Step 1. Install the Telegraf Agent

If you don’t have the Telegraf agent installed, follow the steps below. Otherwise, continue to step 2

Log in to your product instance and follow the instructions on the Setup tab to install Telegraf and a Wavefront proxy in your environment. If a proxy is already running in your environment, you can select that proxy and the Telegraf install command connects with that proxy. Sign up for a free trial to check it out!

Step 2. Install the Jolokia Agent on Your WebLogic Server

  1. Download the latest version of the Jolikia WAR-Agent from: https://jolokia.org/download.html.
  2. Rename the jolokia-war-X.X.X.war file to jolokia.war.
  3. Deploy the jolokia.war file into the WebLogic Server.
  4. Verify the Jolokia agent installation by accessing this URL: http://<address>:<port>/jolokia/version.

Note: Jolokia 1.6 or later uses authentication. Create a user and group, and apply that to the Jolokia web app.

The result looks similar to this:

{"request":{"type":"version"},"value":{"agent":"1.3.7","protocol":"7.2","config":{"maxCollectionSize":"0","agentId":"10.152.24.99-29844-172f5788-servlet","debug":"false","agentType":"servlet","serializeException":"false","detectorOptions":"{}","dispatcherClasses":"org.jolokia.jsr160.Jsr160RequestDispatcher","maxDepth":"15","discoveryEnabled":"false","canonicalNaming":"true","historyMaxEntries":"10","includeStackTrace":"true","maxObjects":"0","debugMaxEntries":"100"},"info":{"product":"tomcat","vendor":"Apache","version":"8.5.23"}},"timestamp":1509955465,"status":200}

Step 3. Configure the Telegraf Jolokia Input Plugin

First create a file called weblogic.conf in /etc/telegraf/telegraf.d and enter the following snippet:

[[inputs.jolokia2_agent]]
urls = ["http://SERVER_URL:PORT/jolokia"]
name_prefix = "weblogic."

#username and password are mandatory for Jolokia 1.6 or later
#username = <jolokia web app username>
#password = <jolokia web app password>

### JVM Generic

[[inputs.jolokia2_agent.metric]]
name  = "OperatingSystem"
mbean = "java.lang:type=OperatingSystem"
paths = ["ProcessCpuLoad","SystemLoadAverage","SystemCpuLoad"]

[[inputs.jolokia2_agent.metric]]
name  = "jvm_runtime"
mbean = "java.lang:type=Runtime"
paths = ["Uptime"]

[[inputs.jolokia2_agent.metric]]
name  = "jvm_memory"
mbean = "java.lang:type=Memory"
paths = ["HeapMemoryUsage", "NonHeapMemoryUsage", "ObjectPendingFinalizationCount"]

[[inputs.jolokia2_agent.metric]]
name     = "jvm_garbage_collector"
mbean    = "java.lang:name=*,type=GarbageCollector"
paths    = ["CollectionTime", "CollectionCount"]
tag_keys = ["name"]

[[inputs.jolokia2_agent.metric]]
name       = "jvm_memory_pool"
mbean      = "java.lang:name=*,type=MemoryPool"
paths      = ["Usage", "PeakUsage", "CollectionUsage"]
tag_keys   = ["name"]
tag_prefix = "pool_"

### WLS

[[inputs.jolokia2_agent.metric]]
name       = "JTARuntime"
mbean      = "com.bea:Name=JTARuntime,ServerRuntime=*,Type=JTARuntime"
paths      = ["SecondsActiveTotalCount","TransactionRolledBackTotalCount","TransactionRolledBackSystemTotalCount","TransactionRolledBackAppTotalCount","TransactionRolledBackResourceTotalCount","TransactionHeuristicsTotalCount","TransactionAbandonedTotalCount","TransactionTotalCount","TransactionRolledBackTimeoutTotalCount","ActiveTransactionsTotalCount","TransactionCommittedTotalCount"]
tag_keys   = ["ServerRuntime"]
tag_prefix = "wls_"

[[inputs.jolokia2_agent.metric]]
name       = "ThreadPoolRuntime"
mbean      = "com.bea:Name=ThreadPoolRuntime,ServerRuntime=*,Type=ThreadPoolRuntime"
paths      = ["StuckThreadCount","CompletedRequestCount","ExecuteThreadTotalCount","ExecuteThreadIdleCount","StandbyThreadCount","Throughput","HoggingThreadCount","PendingUserRequestCount"]
tag_keys   = ["ServerRuntime"]
tag_prefix = "wls_"

[[inputs.jolokia2_agent.metric]]
name       = "JMSRuntime"
mbean      = "com.bea:Name=*.jms,ServerRuntime=*,Type=JMSRuntime"
paths      = ["ConnectionsCurrentCount","ConnectionsHighCount","ConnectionsTotalCount","JMSServersCurrentCount","JMSServersHighCount","JMSServersTotalCount"]
tag_keys   = ["name","ServerRuntime"]
tag_prefix = "wls_"

Then replace the urls value with your WebLogic Server URL. Specify your servers with URL matching.

Format:

urls = ["http://<address>:<port>/<jolokia context>"]

Example:

urls = ["http://wls.foo.com:8080/jolokia"]

To monitor multiple WebLogic Servers, add additional urls entries:

urls = ["http://wls.foo.com:8080/jolokia","http://webapp1.foo.com:8080/jolokia","http://wbapp2.foo.com:8080/jolokia"]

Step 4. Restart Telegraf

Run sudo service telegraf restart to restart your Telegraf agent.