This page provides an overview of what you can do with the VMware vSphere integration. The documentation pages only for a limited number of integrations contain the setup steps and instructions. If you do not see the setup steps here, navigate to the Operations for Applications GUI. The detailed instructions for setting up and configuring all integrations, including the VMware vSphere integration are on the Setup tab of the integration.
- Log in to your Operations for Applications instance.
- Click Integrations on the toolbar, search for and click the VMware vSphere tile.
- Click the Setup tab and you will see the most recent and up-to-date instructions.
vSphere Integration
The vSphere integration offers pre-defined dashboards and pre-defined alert conditions. This integration uses vSphere Telegraf plugin to gather metrics for Clusters, Hosts, VMs and Datastores.
Dashboards
Operations for Applications provides the following dashboards for vSphere:
- Summary
- Cluster
- Datastore
- ESXi Host Summary
- ESXi Host Detail
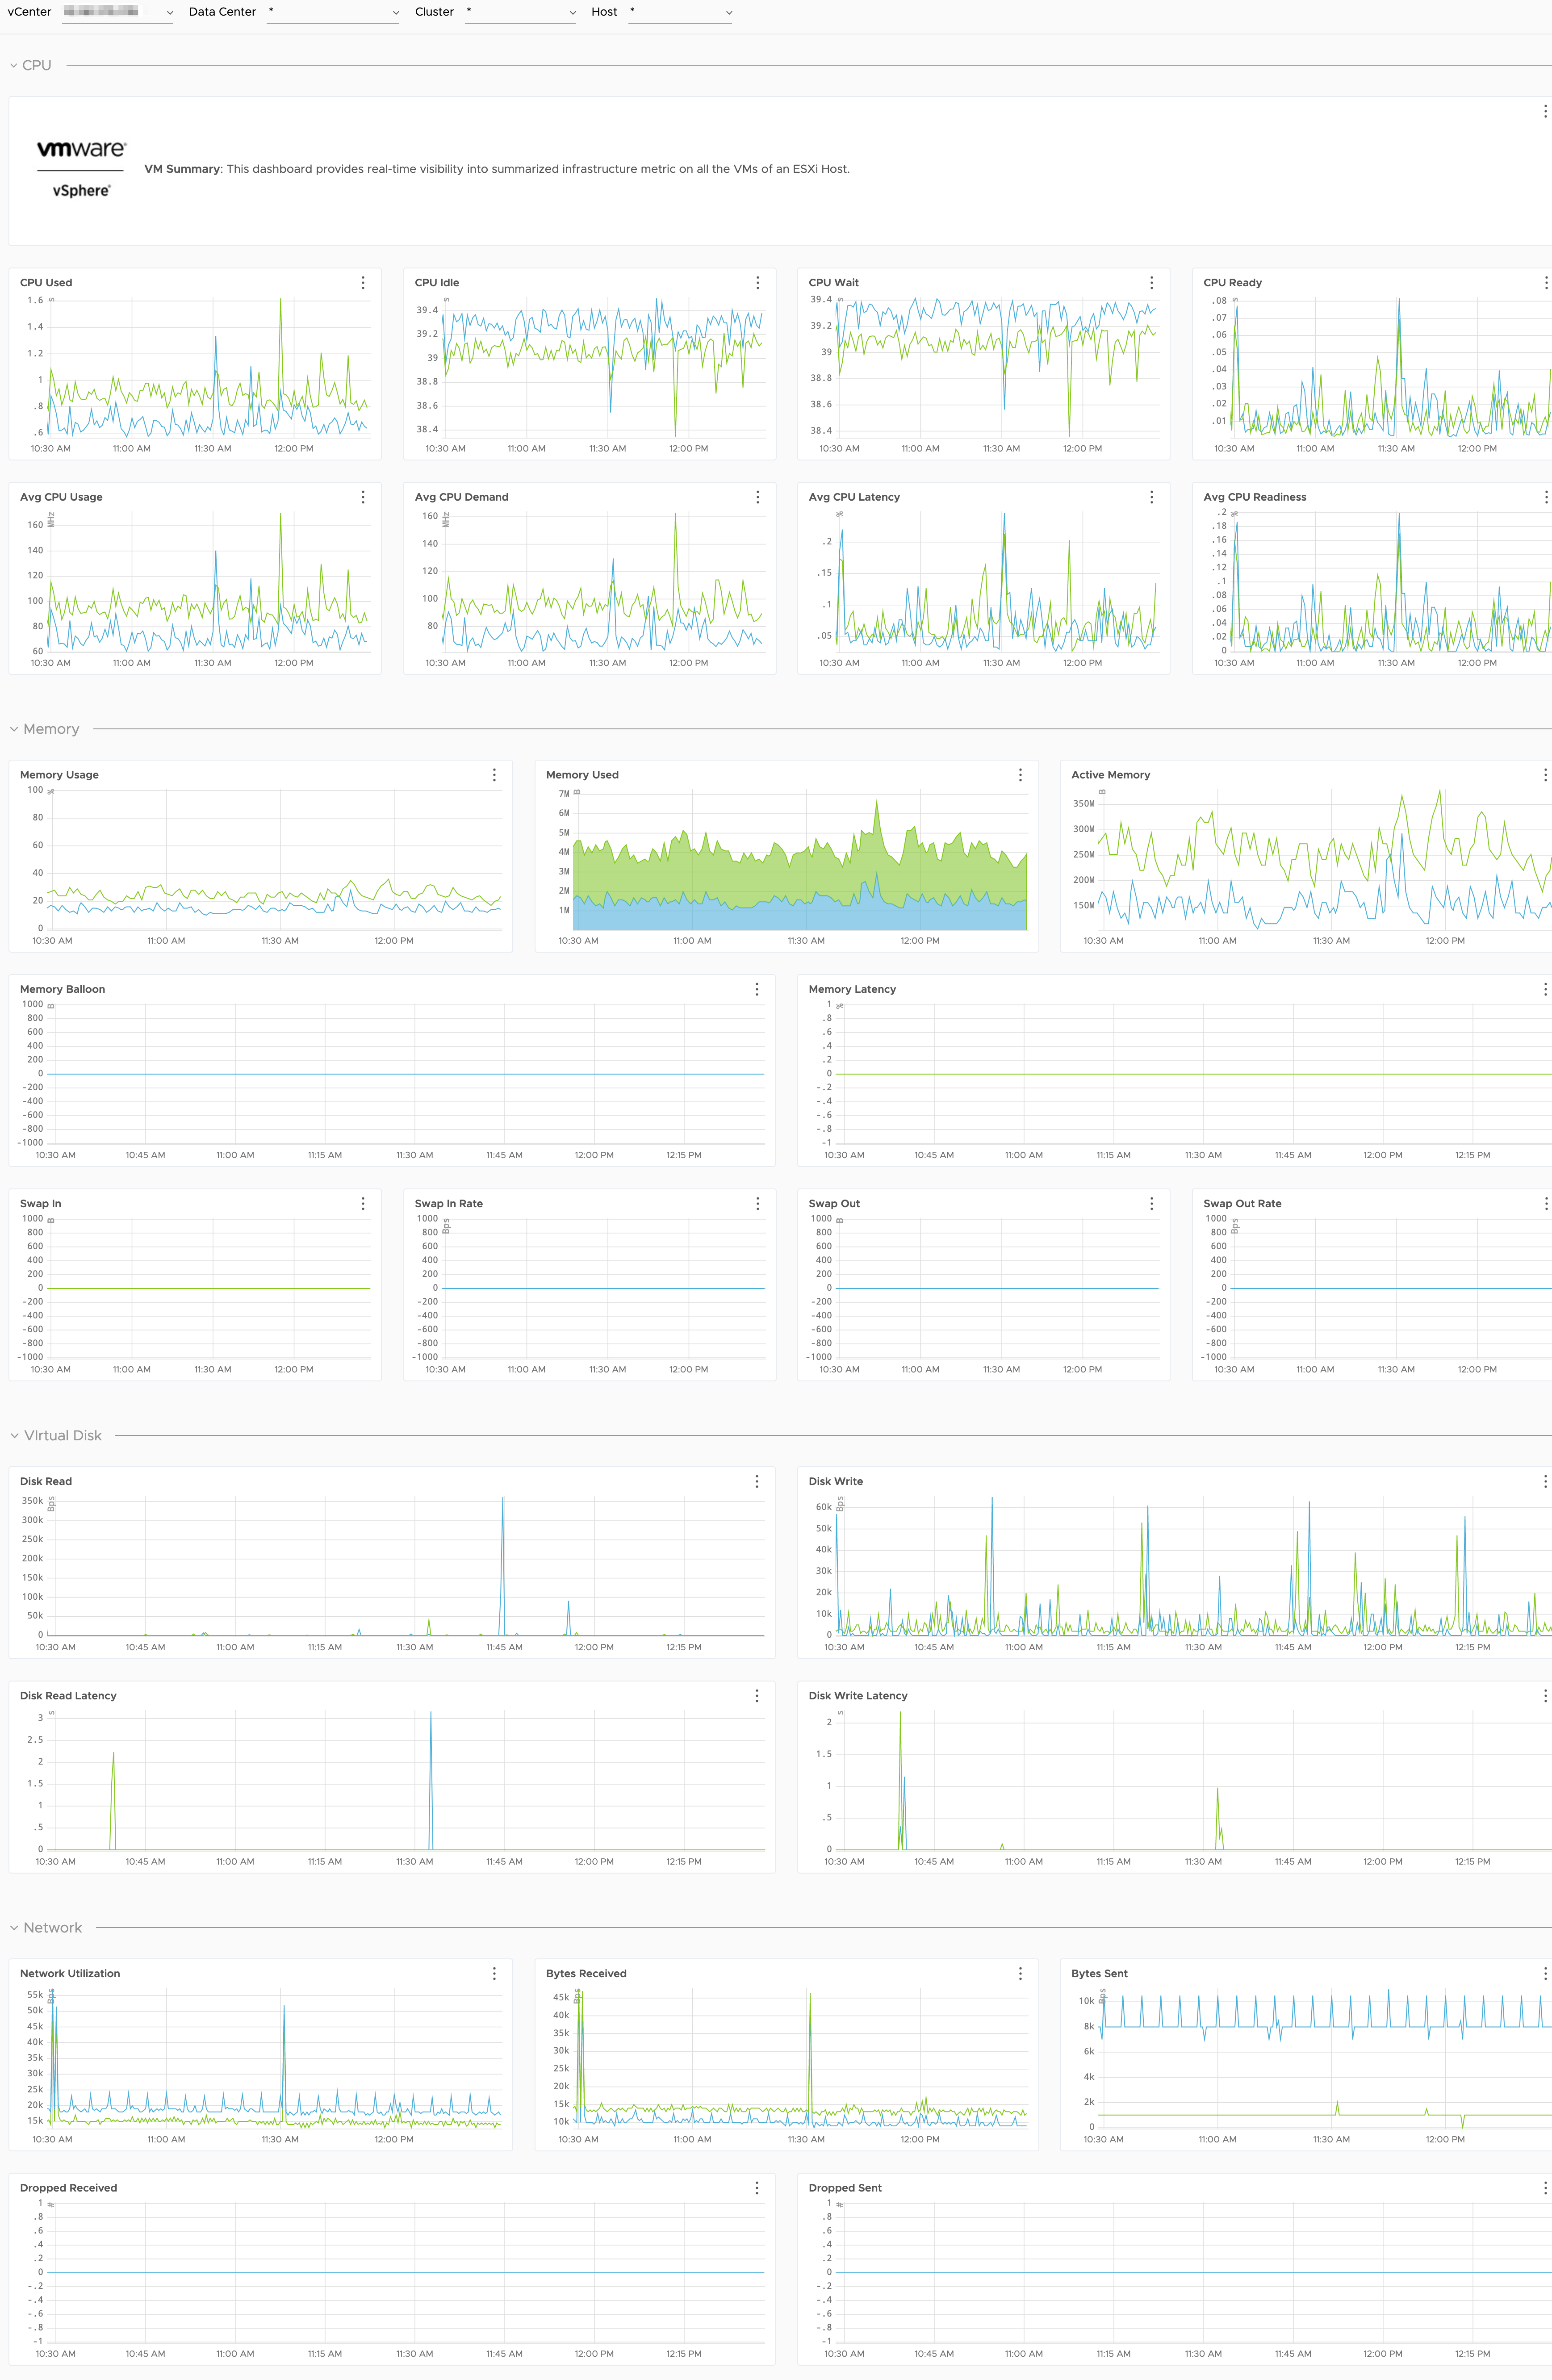
- VM Summary
- VM Details
- VMware vSAN
Summary Dashboard
From the Summary dashboard you can easily navigate to all other vSphere dashboards.

Host and VM System Metrics
The integration includes system metrics for all ESXi Hosts and VMs that are part of your environment.
Metrics Configuration
Operations for Applications ingests vSphere metrics using the vSphere input plugin for Telegraf. For details on the metrics and on how to configure ingestion, see the vSphere plugin details on GitHub.
Metrics for vSphere
The following table lists metrics that the integration collected from a specific environment, and gives a good overview of what to expect. Your environment might include fewer metrics or additional metrics, depending on setup.
| Metric Name | Description |
|---|---|
| vsphere.cluster.mem.overhead.average | Host physical memory consumed by the virtualization infrastructure for running the virtual machine. |
| vsphere.cluster.mem.usage.average | Memory usage as percent of total configured or available memory for a cluster. |
| vsphere.cluster.vmop.numChangeDS.latest | Number of datastore change operations for powered-off and suspended virtual machines for a cluster. |
| vsphere.cluster.vmop.numChangeHost.latest | Number of host change operations for powered-off and suspended virtual machines for a cluster. |
| vsphere.cluster.vmop.numChangeHostDS.latest | Number of host and datastore change operations for powered-off and suspended virtual machines for a cluster. |
| vsphere.cluster.vmop.numClone.latest | Number of virtual machine clone operations for a cluster. |
| vsphere.cluster.vmop.numCreate.latest | Number of virtual machine create operations for a cluster. |
| vsphere.cluster.vmop.numDeploy.latest | Number of virtual machine template deploy operations for a cluster. |
| vsphere.cluster.vmop.numDestroy.latest | Number of virtual machine delete operations for a cluster. |
| vsphere.cluster.vmop.numPoweroff.latest | Number of virtual machine power off operations for a cluster. |
| vsphere.cluster.vmop.numPoweron.latest | Number of virtual machine power on operations for a cluster. |
| vsphere.cluster.vmop.numRebootGuest.latest | Number of virtual machine guest reboot operations for a cluster. |
| vsphere.cluster.vmop.numReconfigure.latest | Number of virtual machine guest reconfigure operations for a cluster. |
| vsphere.cluster.vmop.numRegister.latest | Number of virtual machine register operations for a cluster. |
| vsphere.cluster.vmop.numReset.latest | Number of virtual machine reset operations for a cluster. |
| vsphere.cluster.vmop.numSVMotion.latest | Number of migrations with Storage vMotion (datastore change operations for powered-on VMs) for a cluster. |
| vsphere.cluster.vmop.numShutdownGuest.latest | Number of virtual machine guest shutdown operations for a cluster. |
| vsphere.cluster.vmop.numStandbyGuest.latest | Number of virtual machine standby guest operations for a cluster. |
| vsphere.cluster.vmop.numSuspend.latest | Number of virtual machine suspend operations for a cluster. |
| vsphere.cluster.vmop.numUnregister.latest | Number of virtual machine unregister operations for a cluster. |
| vsphere.cluster.vmop.numVMotion.latest | Number of migrations with vMotion (host change operations for powered-on VMs) for a cluster. |
| vsphere.cluster.vmop.numXVMotion.latest | Number of host and datastore change operations for powered-on and suspended virtual machines for a cluster. |
| vsphere.datacenter.vmop.numChangeDS.latest | Number of datastore change operations for powered-off and suspended virtual machines for a data center. |
| vsphere.datacenter.vmop.numChangeHost.latest | Number of host change operations for powered-off and suspended virtual machines for a data center. |
| vsphere.datacenter.vmop.numChangeHostDS.latest | Number of host and datastore change operations for powered-off and suspended virtual machines for a data center. |
| vsphere.datacenter.vmop.numClone.latest | Number of virtual machine clone operations for a data center. |
| vsphere.datacenter.vmop.numCreate.latest | Number of virtual machine create operations for a data center. |
| vsphere.datacenter.vmop.numDeploy.latest | Number of virtual machine template deploy operations for a data center. |
| vsphere.datacenter.vmop.numDestroy.latest | Number of virtual machine delete operations for a data center. |
| vsphere.datacenter.vmop.numPoweroff.latest | Number of virtual machine power off operations for a data center. |
| vsphere.datacenter.vmop.numPoweron.latest | Number of virtual machine power on operations for a data center. |
| vsphere.datacenter.vmop.numRebootGuest.latest | Number of virtual machine guest reboot operations for a data center. |
| vsphere.datacenter.vmop.numReconfigure.latest | Number of virtual machine guest reconfigure operations for a data center. |
| vsphere.datacenter.vmop.numRegister.latest | Number of virtual machine register operations for a data center. |
| vsphere.datacenter.vmop.numReset.latest | Number of virtual machine reset operations for a data center. |
| vsphere.datacenter.vmop.numSVMotion.latest | Number of migrations with Storage vMotion (datastore change operations for powered-on VMs) for a data center. |
| vsphere.datacenter.vmop.numShutdownGuest.latest | Number of virtual machine guest shutdown operations for a data center. |
| vsphere.datacenter.vmop.numStandbyGuest.latest | Number of virtual machine standby guest operations for a data center. |
| vsphere.datacenter.vmop.numSuspend.latest | Number of virtual machine suspend operations for a data center. |
| vsphere.datacenter.vmop.numUnregister.latest | Number of virtual machine unregister operations for a data center. |
| vsphere.datacenter.vmop.numVMotion.latest | Number of migrations with vMotion (host change operations for powered-on VMs) for a data center. |
| vsphere.datacenter.vmop.numXVMotion.latest | Number of host and datastore change operations for powered-on and suspended virtual machines for a data center. |
| vsphere.datastore.datastore.numberReadAveraged.average | Average number of read commands issued per second to the datastore. |
| vsphere.datastore.datastore.numberWriteAveraged.average | Average number of write commands issued per second to the datastore during the collection. |
| vsphere.datastore.disk.capacity.latest | Configured size of the datastore. |
| vsphere.datastore.disk.provisioned.latest | Amount of storage set aside for use by a datastore or a virtual machine. Files on the datastore and the virtual machine can expand to this size but not beyond it. |
| vsphere.datastore.disk.used.latest | Amount of space actually used by the virtual machine or the datastore. Can be less than the amount provisioned at any given time, depending on whether the virtual machine is powered-off, whether snapshots have been created or not, and other factors. |
| vsphere.host.cpu.coreUtilization.average | CPU utilization of the corresponding core (if hyper-threading is enabled) as a percentage for a host. |
| vsphere.host.cpu.costop.summation | Time the virtual machine is ready to run, but is unable to run due to co-scheduling constraints for a host. |
| vsphere.host.cpu.demand.average | The amount of CPU resources a virtual machine would use if there were no CPU contention or CPU limit for a host. |
| vsphere.host.cpu.idle.summation | Total time that the CPU spent in an idle state for a host. |
| vsphere.host.cpu.latency.average | Percent of time the virtual machine is unable to run because it is contending for access to the physical CPUs for a host. |
| vsphere.host.cpu.readiness.average | Percentage of time that the virtual machine was ready, but could not get scheduled to run on the physical CPU for a host. |
| vsphere.host.cpu.ready.summation | Milliseconds of CPU time spent in ready state for a host. |
| vsphere.host.cpu.swapwait.summation | CPU time spent waiting for swap-in for a host. |
| vsphere.host.cpu.usage.average | Percentage of CPU capacity being used for a host. |
| vsphere.host.cpu.usagemhz.average | Total megehertz of CPU being used for a host. |
| vsphere.host.cpu.used.summation | Time accounted to the virtual machine for a host. If a system service runs on behalf of this virtual machine, the time spent by that service (represented by cpu.system) should be charged to this virtual machine. If not, the time spent (represented by cpu.overlap) should not be charged against this virtual machine. |
| vsphere.host.cpu.utilization.average | CPU utilization as a percentage during the interval (CPU usage and CPU utilization might be different due to power management technologies or hyper-threading) for a host. |
| vsphere.host.cpu.wait.summation | Total CPU time spent in wait state for a host.The wait total includes time spent the CPU Idle, CPU Swap Wait, and CPU I/O Wait states. |
| vsphere.host.disk.deviceReadLatency.average | Average amount of time it takes to read from a physical device for a host. |
| vsphere.host.disk.deviceWriteLatency.average | Average amount of time it takes to write to a physical device for a host. |
| vsphere.host.disk.kernelReadLatency.average | Average amount of time spent by the VMkernel to process each SCSI read command for a host. |
| vsphere.host.disk.kernelWriteLatency.average | Average amount of time spent by the VMkernel to process each SCSI write command for a host. |
| vsphere.host.disk.numberReadAveraged.average | Average number of read commands issued per second to the datastore for a host. |
| vsphere.host.disk.numberWriteAveraged.average | Average number of write commands issued per second to the datastore for a host. |
| vsphere.host.disk.read.average | Average number of kilobytes read from the disk each second for a host. |
| vsphere.host.disk.totalReadLatency.average | Average amount of time taken to process a SCSI read command issued from the guest OS to the virtual machine for a host. |
| vsphere.host.disk.totalWriteLatency.average | Average amount of time taken to process a SCSI write command issued by the guest OS to the virtual machine for a host. |
| vsphere.host.disk.write.average | Average number of kilobytes written to the disk each second for a host. |
| vsphere.host.mem.active.average | Amount of memory that is actively used, as estimated by the VMkernel based on recently touched memory pages for a host. |
| vsphere.host.mem.latency.average | Percentage of time the virtual machine is waiting to access swapped or compressed memory for a host. |
| vsphere.host.mem.state.latest | One of four threshold levels representing the percentage of free memory on the host. The counter value determines swapping and ballooning behavior for memory reclamation. |
| vsphere.host.mem.swapin.average | Amount of memory swapped-in from disk for a host. |
| vsphere.host.mem.swapinRate.average | Rate at which memory is swapped from disk into active memory for a host. |
| vsphere.host.mem.swapout.average | Amount of memory swapped-out to disk for a host. |
| vsphere.host.mem.swapoutRate.average | Rate at which memory is being swapped from active memory to disk for a host. |
| vsphere.host.mem.totalCapacity.average | Total amount of memory reservation used by and available for powered-on virtual machines and vSphere services on the host. |
| vsphere.host.mem.usage.average | Memory usage as percent of total configured or available memory for a host. |
| vsphere.host.mem.vmmemctl.average | Amount of memory allocated by the virtual machine memory control driver (vmmemctl) for a host. |
| vsphere.host.net.bytesRx.average | Average amount of data received per second for a host. |
| vsphere.host.net.bytesTx.average | Average amount of data transmitted per second for a host. |
| vsphere.host.net.droppedRx.summation | Number of received packets dropped for a host. |
| vsphere.host.net.droppedTx.summation | Number of transmitted packets dropped for a host. |
| vsphere.host.net.errorsRx.summation | Number of packets with errors received for a host. |
| vsphere.host.net.errorsTx.summation | Number of packets with errors transmitted for a host. |
| vsphere.host.net.usage.average | Network utilization (combined transmit- and receive-rates) for a host. |
| vsphere.host.power.power.average | Current power usage for a host. |
| vsphere.host.storageAdapter.numberReadAveraged.average | Average number of read commands issued per second by the storage adapter for a host. |
| vsphere.host.storageAdapter.numberWriteAveraged.average | Average number of write commands issued per second by the storage adapter for a host. |
| vsphere.host.storageAdapter.read.average | Rate of reading data by the storage adapter for a host. |
| vsphere.host.storageAdapter.write.average | Rate of writing data by the storage adapter for a host. |
| vsphere.host.sys.uptime.latest | ESXi host uptime. |
| vsphere.vm.cpu.demand.average | The amount of CPU resources a virtual machine would use if there were no CPU contention or CPU limit. |
| vsphere.vm.cpu.idle.summation | Total time that the CPU spent in an idle state for a vitual machine. |
| vsphere.vm.cpu.latency.average | Percent of time the virtual machine is unable to run because it is contending for access to the physical CPUs. |
| vsphere.vm.cpu.readiness.average | Percentage of time that the virtual machine was ready, but could not get scheduled to run on the physical CPU. |
| vsphere.vm.cpu.ready.summation | Milliseconds of CPU time spent in ready state for a virtual machine. |
| vsphere.vm.cpu.run.summation | Time the virtual machine is scheduled to run. |
| vsphere.vm.cpu.usagemhz.average | Total megehertz of CPU being used for a virtual machine. |
| vsphere.vm.cpu.used.summation | Time accounted to the virtual machine. If a system service runs on behalf of this virtual machine, the time spent by that service (represented by cpu.system) should be charged to this virtual machine. If not, the time spent (represented by cpu.overlap) should not be charged against this virtual machine. |
| vsphere.vm.cpu.wait.summation | Total CPU time spent in wait state for a virtual machine.The wait total includes time spent the CPU Idle, CPU Swap Wait, and CPU I/O Wait states. |
| vsphere.vm.mem.active.average | Amount of memory that is actively used, as estimated by the VMkernel based on recently touched memory pages for a virtual machine. |
| vsphere.vm.mem.granted.average | Amount of host physical memory or physical memory that is mapped for a virtual machine or a host. |
| vsphere.vm.mem.latency.average | Percentage of time the virtual machine is waiting to access swapped or compressed memory. |
| vsphere.vm.mem.swapin.average | Amount of memory swapped-in from host cache for a virtual machine. |
| vsphere.vm.mem.swapinRate.average | Rate at which memory is being swapped from host cache into active memory for a virtual machine. |
| vsphere.vm.mem.swapout.average | Amount of memory swapped-out to host cache for a virtual machine. |
| vsphere.vm.mem.swapoutRate.average | Rate at which memory is being swapped from active memory to host cache for a virtual machine. |
| vsphere.vm.mem.usage.average | Memory usage as percent of total configured or available memory for a virtual machine. |
| vsphere.vm.mem.vmmemctl.average | Amount of memory allocated by the virtual machine memory control driver (vmmemctl). |
| vsphere.vm.net.bytesRx.average | Average amount of data received per second for a virtual machine. |
| vsphere.vm.net.bytesTx.average | Average amount of data transmitted per second for a virtual machine. |
| vsphere.vm.net.droppedRx.summation | Number of received packets dropped for a virtual machine. |
| vsphere.vm.net.droppedTx.summation | Number of transmitted packets dropped for a virtual machine. |
| vsphere.vm.net.usage.average | Network utilization (combined transmit- and receive-rates) for a virtual machine. |
| vsphere.vm.power.power.average | Current power usage for a virtual machine. |
| vsphere.vm.sys.uptime.latest | ESXi host uptime. |
| vsphere.vm.virtualDisk.numberReadAveraged.average | Average number of read commands issued per second to the virtual disk for a virtual machine. |
| vsphere.vm.virtualDisk.numberWriteAveraged.average | Average number of write commands issued per second to the virtual disk for a virtual machine. |
| vsphere.vm.virtualDisk.read.average | Average number of kilobytes read from the virtual disk each second for a virtual machine. |
| vsphere.vm.virtualDisk.readOIO.latest | VM virtual disk reads. |
| vsphere.vm.virtualDisk.totalReadLatency.average | Average amount of time for a read operation from the virtual disk. |
| vsphere.vm.virtualDisk.totalWriteLatency.average | Average amount of time for a write operation from the virtual disk. |
| vsphere.vm.virtualDisk.write.average | Average number of kilobytes written to the virtual disk each second. |
| vsphere.vm.virtualDisk.writeOIO.latest | VM virtual disk writes. |