This page provides an overview of what you can do with the VMware Tanzu Service Mesh integration. The documentation pages only for a limited number of integrations contain the setup steps and instructions. If you do not see the setup steps here, navigate to the Operations for Applications GUI. The detailed instructions for setting up and configuring all integrations, including the VMware Tanzu Service Mesh integration are on the Setup tab of the integration.
- Log in to your Operations for Applications instance.
- Click Integrations on the toolbar, search for and click the VMware Tanzu Service Mesh tile.
- Click the Setup tab and you will see the most recent and up-to-date instructions.
Tanzu Service Mesh Integration
Tanzu Service Mesh provides advanced, end-to-end connectivity, security, and insights for modern applications across application end-users, microservices, APIs, and data. It enables compliance with Service Level Objectives (SLOs) and data protection and privacy regulations.
Click the Setup tab for instructions on setting up your environment to send Tanzu Service Mesh metrics to Operations for Applications.
This integration uses Prometheus to scrape Istio mesh metrics and federate them. It uses the Kubernetes Metrics Collector to forward these metrics to Operations for Applications.
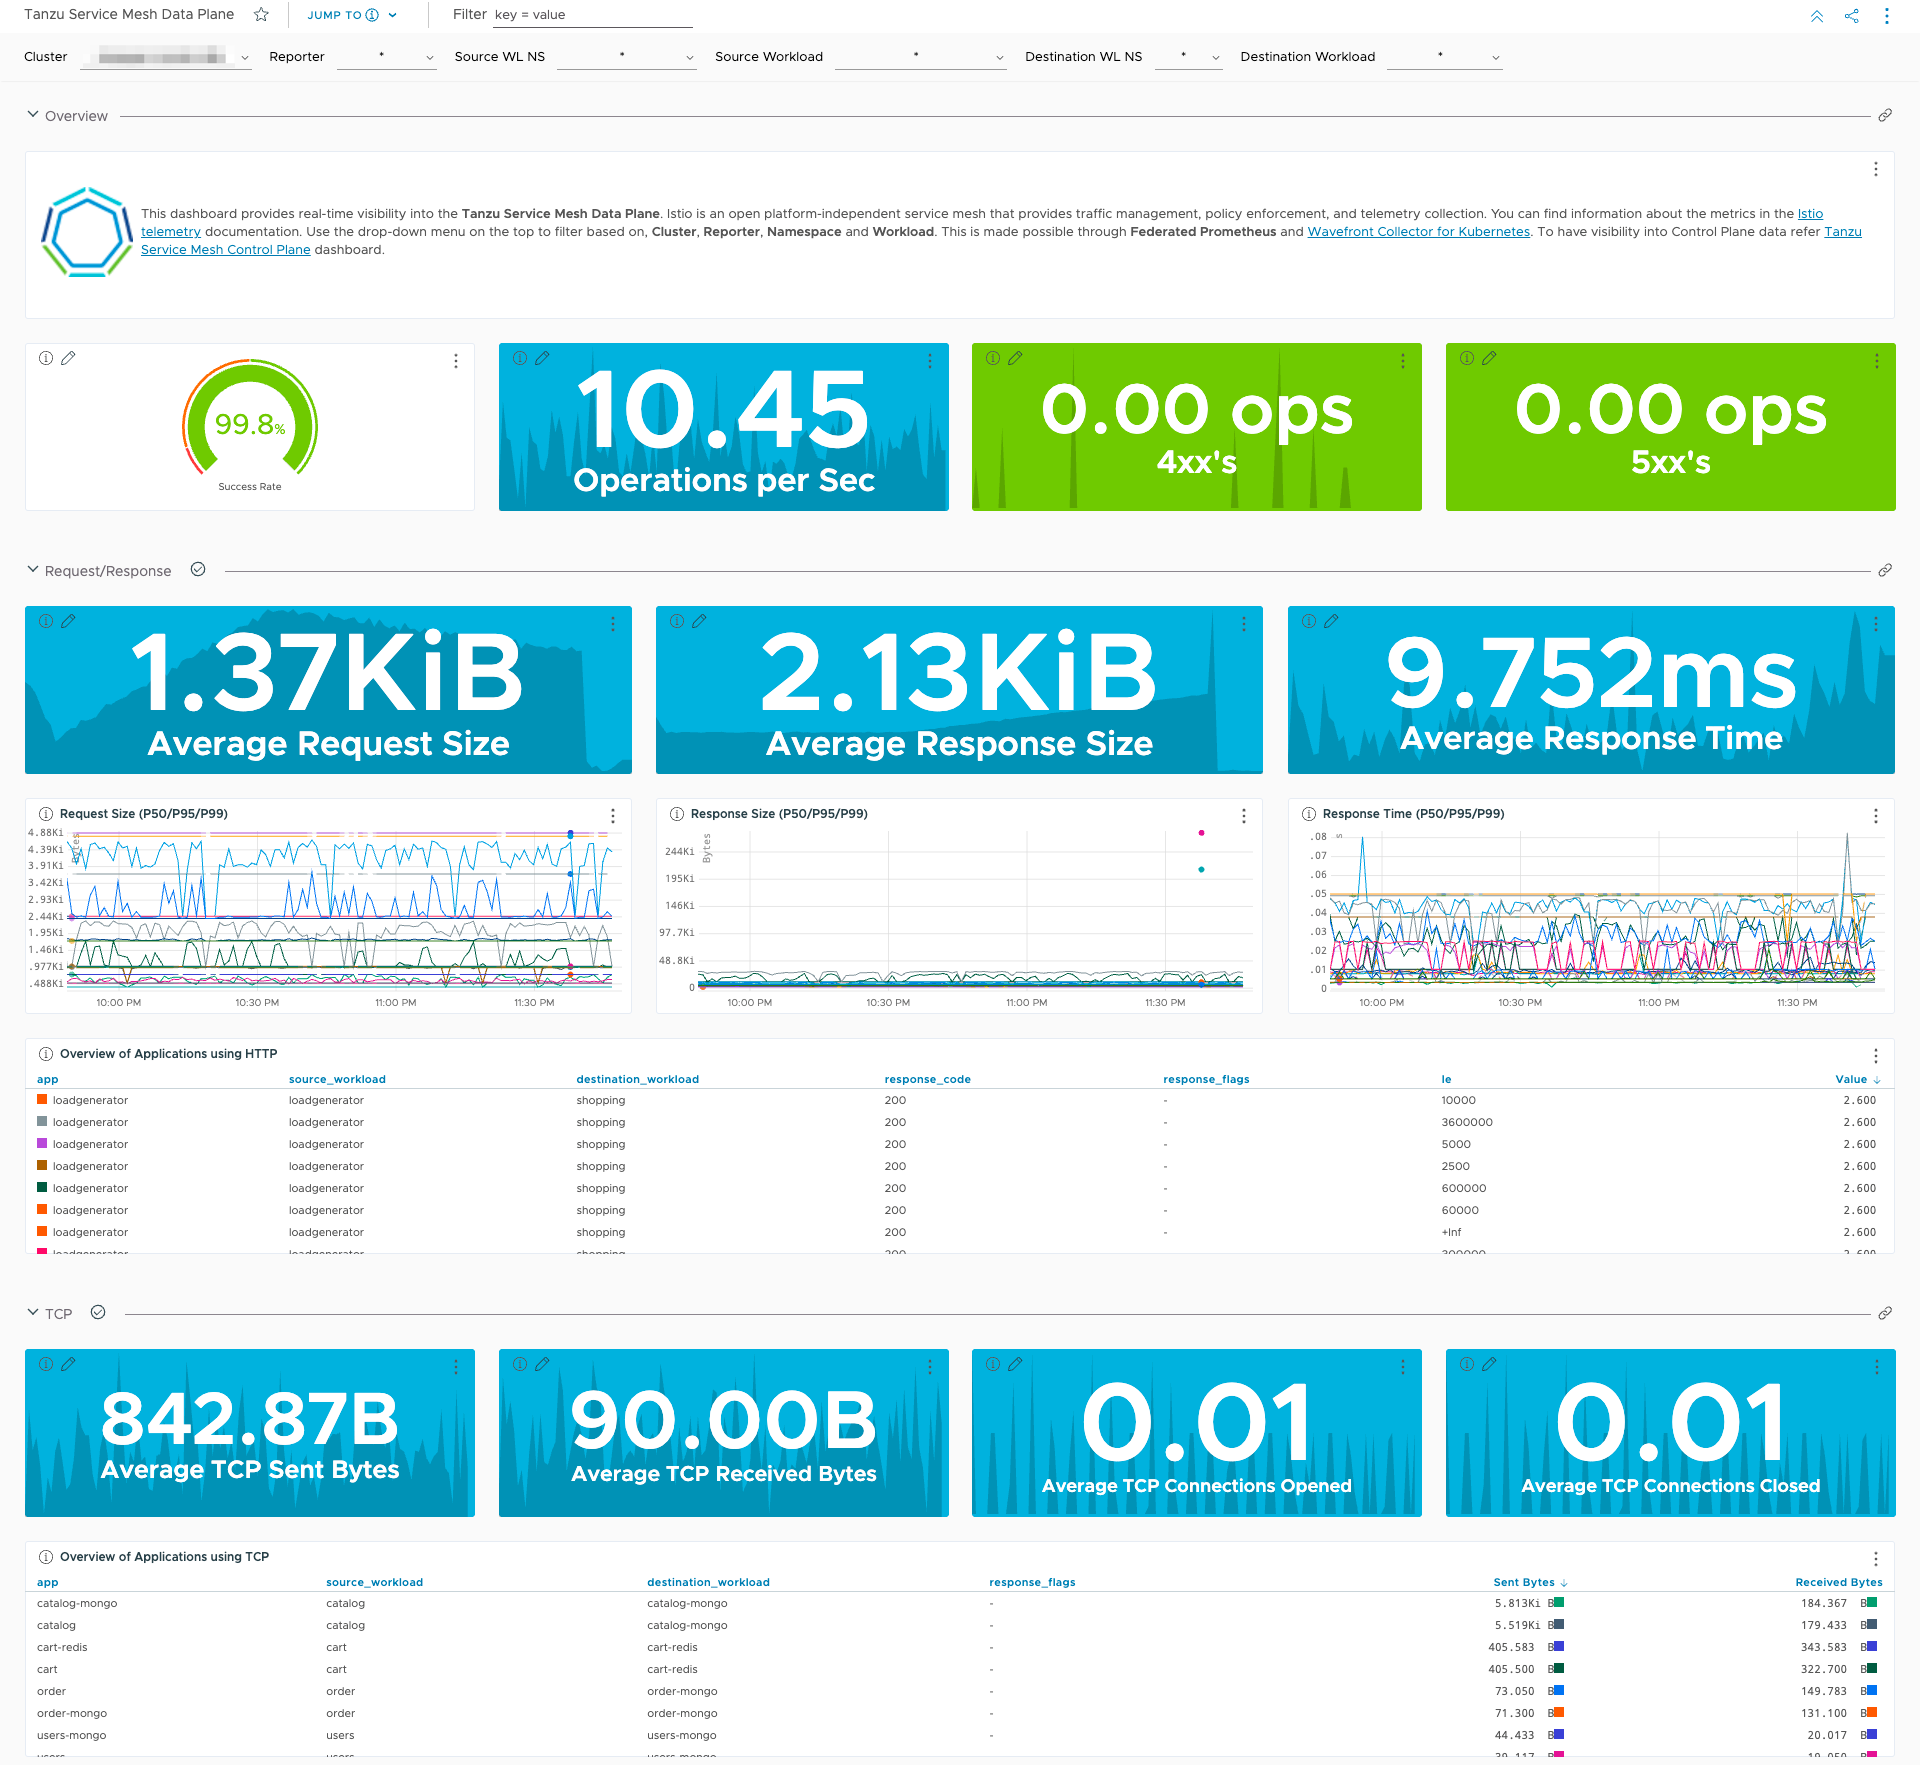
This integration also installs dashboards. Here’s a preview of the Tanzu Service Mesh Data Plane and Control Plane dashboards:

Metrics
| Metric Name | Description |
|---|---|
| tsm.istio.request.bytes.*.value | This is a DISTRIBUTION which measures the HTTP request body sizes. Statistics: bucket, p50, p75, p90, p95, p99, p999, count, sum. |
| tsm.istio.request.duration.milliseconds.*.value | This is a DISTRIBUTION which measures the duration of requests. Statistics: bucket, p50, p75, p90, p95, p99, p999, count, sum. |
| tsm.istio.requests.total.value | This is a COUNTER incremented for every request handled by an Istio proxy. |
| tsm.istio.response.bytes.*.value | This is a DISTRIBUTION which measures the HTTP response body sizes. Statistics: bucket, p50, p75, p90, p95, p99, p999, count, sum. |
| tsm.istio.tcp.sent.bytes.total.value | This is a DISTRIBUTION which measures the HTTP response body sizes. |
| tsm.istio.tcp.received.bytes.total.value | This is a COUNTER which measures the size of total bytes received during request in case of a TCP connection. |
| tsm.istio.tcp.connections.opened.total.value | This is a COUNTER incremented for every opened connection. |
| tsm.istio.tcp.connections.closed.total.value | This is a COUNTER incremented for every closed connection. |
| tsm.pilot.services.value | The total services known to tsm.pilot. |
| tsm.pilot.virt.services.value | The total virtual services known to tsm.pilot. |
| tsm.istio.build.value | Istio component build info. |
| tsm.pilot.xds.pushes.value | Pilot build and send errors for LDS, RDS, CDS, and EDS. |
| tsm.pilot.total.xds.rejects.value | The total number of XDS responses from pilot rejected by proxy. |
| tsm.pilot.xds.cds.reject.value | Pilot rejected CDS configs. |
| tsm.pilot.xds.eds.reject.value | Pilot rejected EDS. |
| tsm.pilot.xds.lds.reject.value | Pilot rejected LDS. |
| tsm.pilot.xds.rds.reject.value | Pilot rejected RDS. |
| tsm.pilot.xds.write.timeout.value | Pilot XDS response write timeouts. |
| tsm.pilot.xds.push.context.errors.value | The number of errors (timeouts) initiating push context. |
| tsm.pilot.conflict.inbound.listener.value | The number of conflicting inbound listeners. |
| tsm.pilot.total.xds.internal.errors.value | The total number of internal XDS errors in tsm.pilot. |
| tsm.pilot.conflict.outbound.listener.http.over.current.tcp.value | The number of conflicting wildcard HTTP listeners with current wildcard TCP listener. |
| tsm.pilot.conflict.outbound.listener.tcp.over.current.http.value | The number of conflicting wildcard TCP listeners with current wildcard HTTP listener. |
| tsm.pilot.conflict.outbound.listener.tcp.over.current.tcp.value | The number of conflicting TCP listeners with current TCP listener. |
| tsm.pilot.proxy.convergence.time.bucket.value | Delay in seconds between config change and a proxy receiving all required configuration. |
| tsm.pilot.proxy.queue.time.bucket.value | Time in seconds, a proxy is in the push queue before being dequeued. |
| tsm.process.cpu.seconds.total.value | Total user and system CPU time spent in seconds. |
| tsm.process.resident.memory.bytes.value | Resident memory size in bytes. |
| tsm.process.virtual.memory.bytes.value | Virtual memory size in bytes. |
| tsm.galley.validation.http.error.value | Resource validation HTTP serve errors. |
| tsm.galley.validation.failed.value | Resource validation failed. |
| tsm.galley.validation.passed.value | Resource is valid. |
| tsm.galley.validation.config.updates.value | K8s webhook configuration updates. |
| tsm.galley.validation.config.update.error.value | K8s webhook configuration update error. |
| tsm.galley.validation.config.load.value | K8s webhook configuration loads. |
| tsm.galley.validation.config.load.error.value | K8s webhook configuration load or reload error. |
| tsm.galley.validation.config.delete.error.value | K8s webhook configuration delete error. |
| tsm.citadel.server.csr.count.value | The number of CSRs received by the Citadel server. |
| tsm.citadel.server.success.cert.issuance.count.value | The number of certificates issuances that have succeeded. |
| tsm.citadel.server.csr.sign.error.count.value | The number of errors occurred when signing the CSR. |
| tsm.go.goroutines.value | Number of goroutines that currently exist. |
| tsm.go.memstats.alloc.bytes.value | Number of bytes allocated and still in use. |
| tsm.go.memstats.heap.alloc.bytes.value | Bytes allocated to the heap. |
| tsm.go.memstats.heap.inuse.bytes.value | Number of bytes in the heap. |
| tsm.go.memstats.heap.sys.bytes.value | Number of bytes used by the heap. |
| tsm.go.memstats.stack.inuse.bytes.value | Number of bytes in use by the stack allocator. |