Summary
rawavg(<tsExpression>[,metrics|sources|sourceTags|pointTags|<pointTagKey>])
Returns the raw average (mean) of the time series described by the expression.
The results are computed from real reported data values only.
Use avg() to include interpolated values.
Parameters
| Parameter | Description |
|---|---|
| tsExpression | Expression describing the set of time series to be averaged. |
| metrics|sources|sourceTags|pointTags|<pointTagKey> | Optional group by parameter for organizing the time series into subgroups and then returning the raw average for each subgroup.
Use one or more parameters to group by metric names, source names, source tag names, point tag names, values for a particular point tag key, or any combination of these items. Specify point tag keys by name. |
Description
The rawavg() aggregation function averages the data values reported at each moment in time, across the time series that are represented by the expression.
By default, rawavg() returns a single series of averages by aggregating data values across all time series. You can optionally group the time series based on one or more characteristics, and obtain a separate series of averages for each group.
A raw average is computed only from real values reported at a given moment in time.
No interpolation is performed to fill in data gaps in any time series.
Use avg() if you want the averages to include interpolated values wherever possible. Using rawavg() instead of avg() can significantly improve query performance.
Grouping
Like all aggregation functions, rawavg() returns a single series of results by default. You can include a group by parameter to obtain separate raw averages for groups of time series that share common metric names, source names, source tags, point tags, or values for a particular point tag key.
The function returns a separate series of results corresponding to each group.
You can specify multiple ‘group by’ parameters to group the time series based on multiple characteristics. For example, rawavg(ts("cpu.cpu*"), metrics, Customer) first groups by metric names, and then groups by the values of the Customer point tag.
zone and ZONE, when you use an aggregation function and apply grouping, we consider zone and ZONE as separate tags. Example
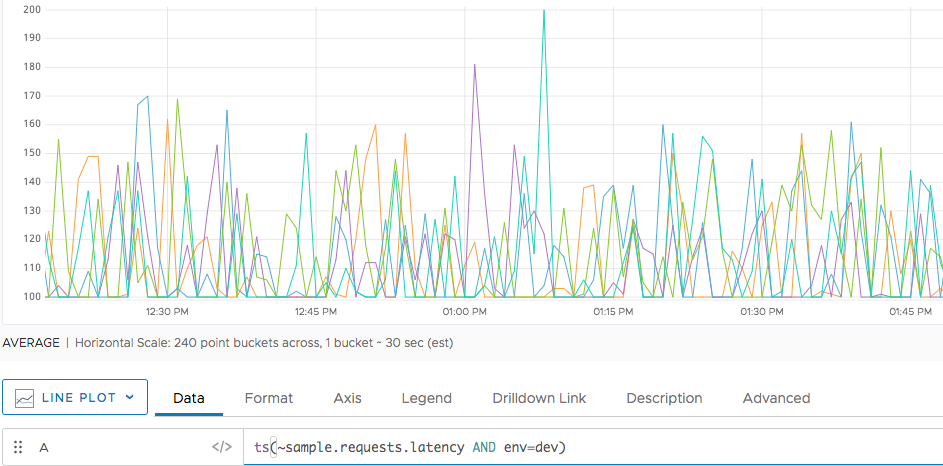
The following example shows the data for sample.requests.loadavg. To limit the number of lines, we’re filtering to show only time series with env=dev.
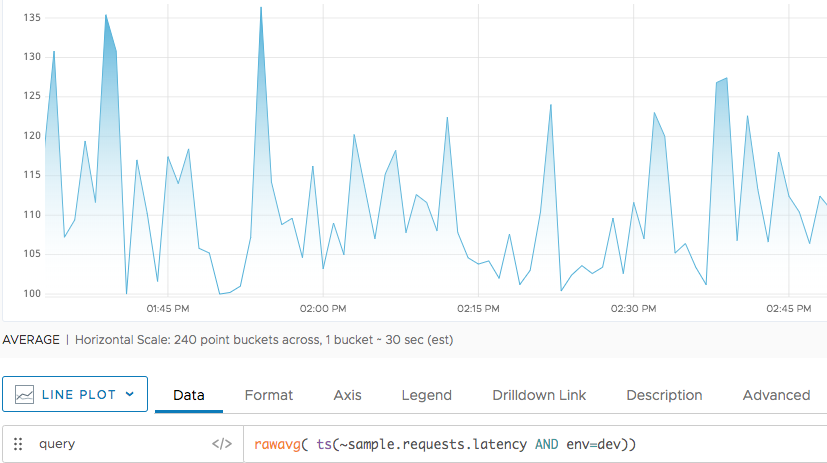
When we apply rawavg() we get a single line.