Reference to the mvar() function
Summary
mvar(<timeWindow>, <tsExpression>)
Returns the moving variance for each series over the specified time window.
Parameters
| Parameter | Description |
|---|---|
| timeWindow | Amount of time in the moving time window. You can specify a time measurement based on the clock or calendar (1s, 1m, 1h, 1d, 1w), the window length (1vw) of the chart, or the bucket size (1bw) of the chart. Default is minutes if the unit is not specified. |
| tsExpression | Expression that describes the time series you want moving variances for. |
Description
The mvar() function computes the moving variance of each time series over a shifting time window. For example, mvar(60m, ts(my.metric)) returns, at each point, the variance in the data values over the previous 60 minutes for each specified time series.
You can apply the sqrt() function to mvar() to get the moving standard deviation, for example: sqrt(mvar(120m, ts(my.metric))).
Example
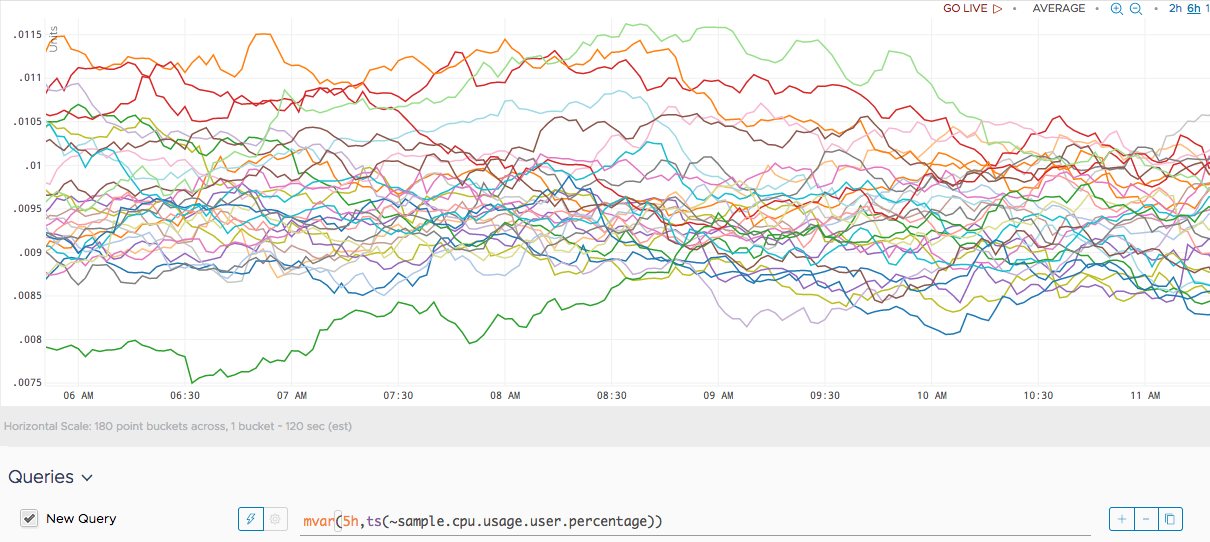
The following example computes the moving variance for the CPU usage user percentage over 5 hours.
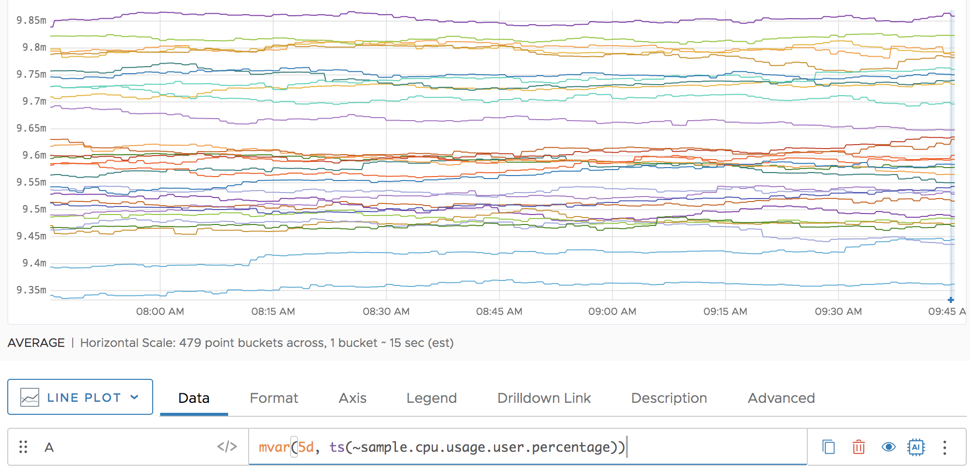
We can see that the variance flattens out as we look at 5 days.
See Also
Using Moving and Tumbling Windows to Highlight Trends
Detecting Anomalies With Functions and Statistical Functions