Summary
msum(<timeWindow>, <tsExpression>)
Returns the moving sum of each time series over the specified time window.
Parameters
| Parameter | Description |
|---|---|
| timeWindow | Amount of time in the moving time window. You can specify a time measurement based on the clock or calendar (1s, 1m, 1h, 1d, 1w), the window length (1vw) of the chart, or the bucket size (1bw) of the chart. Default is minutes if the unit is not specified. |
| tsExpression | Expression that describes the time series you want moving sums for. |
Description
The msum() function computes the moving sum of each time series over a shifting time window. For example, msum(10m, ts(my.metric)) returns, at each point, the sum of the data values over the previous 10 minutes for each specified time series.
At times, using msum() instead of mavg() can get you the information you want. In that case, use msum() because performance is better.
Example
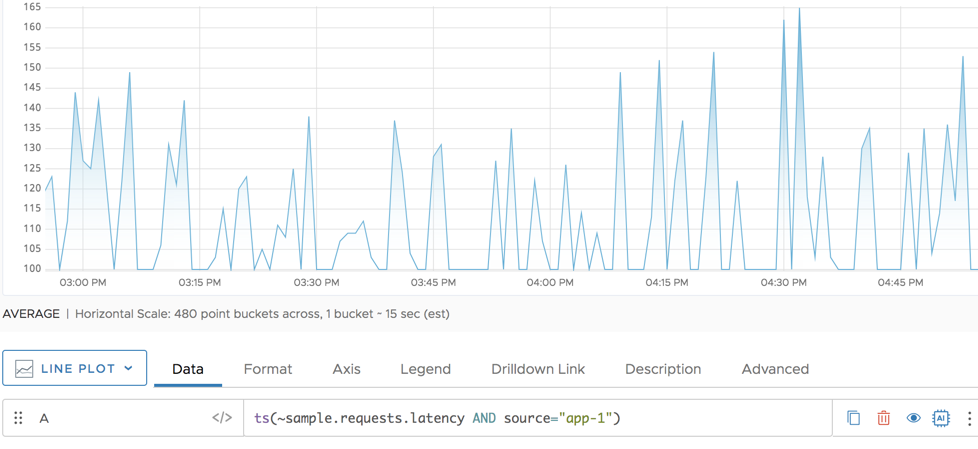
The following example shows the sample requests latency for one of the sources.
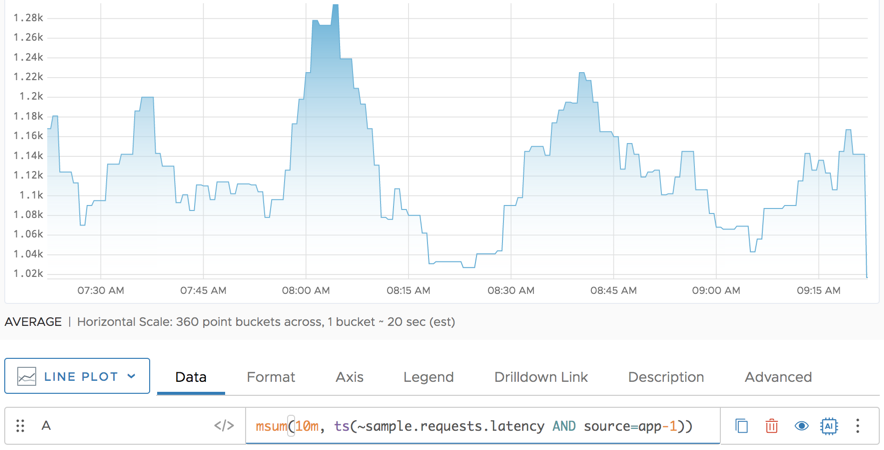
And here’s the information you see when you apply the msum() function. In particular, you get a clearer pictures of the times where latency was consistently a problem because the function works on the last 10 minutes.
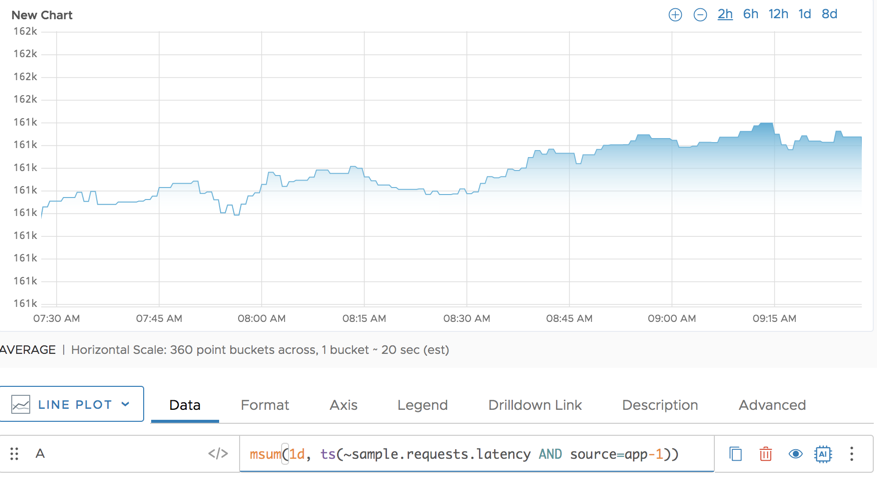
You can get an even clearer picture of trends if you pick a bigger time window, as in the following example that sums all points over the last 1d, and shows that information in an 8d view window.
Caveats
The query engine pre-aligns metrics for performance reasons when more than 100 time series are used in an aggregate function and displays a warning. In most cases, for instance, where a metric reflects a parameter changing over time, you can ignore the warning.
However, for certain use cases, pre-alignment can cause undesirable side effects. Suppose you have a http.requests.count metric that reports values once a minute and represents the total number of HTTP requests per minute. You are trying to calculate the number of HTTP requests over the 1-hour sliding window (i.e. msum(1h, rawsum(ts(http.requests.count, source="web*")). Your data set is pre-aligned to a 2-minute (120s) time window.
If you are using the default summarization method (Average), then align(120s, mean) averages the values for every 2-minute window, effectively cutting the number of values that are available to msum() in half and dramatically changing the result of the calculation.
In this case, doing an explicit align() with the sum() aggregation method or changing the summarization method used by align() to Sum avoids the side effect.