Summary
mcount(<timeWindow>, <tsExpression>)
Returns the number of data points reported over the specified time window. If a time series stops reporting data, mcount() continues for 2x the specified time window, and then stops.
Use the count () function, if you want to add together the number of reporting time series represented by the expression, at each moment in time.
Parameters
| Parameter | Description |
|---|---|
| timeWindow | Amount of time in the moving time window. You can specify a time measurement based on the clock or calendar (1s, 1m, 1h, 1d, 1w), the window length (1vw) of the chart, or the bucket size (1bw) of the chart. Default is minutes if the unit is not specified.
NOTE: If a time series stops reporting data, mcount() reports 0 for 2x the specified time window, and then stops. |
| tsExpression | Expression that describes the time series you want moving counts for. |
Description
The mcount() function returns the moving count for each time series described by the expression. The moving count is the number of data points reported by a time series over a shifting time window. For example, mcount(10m, ts(my.metric)) returns, at each point, the number data values over the previous 10 minutes for each specified time series.
If a time series stops reporting data, mcount() continues to return the moving count until 2x the time window after the last reported point, and returns no data after that. Later, if the time series starts to report data again, the data gap between the last point returned by mcount() and the new point gets filled with zeros.
Here’s how to select your counting/summing function:
mcount()- returns the number of data points reported over a shifting time windowmsum()- returns the sum of the data points reported over a shifting time windowcount()- returns the number of time series reporting at each moment in timemseriescount()- returns the number of time series reporting during a shifting time window
Common use cases include finding missing data points. Because of that, mcount() is often used with alerts.
Examples
Example 1
The following example queries the ambient air temperature in a vehicle using this query:
ts(vehicle.ambient_air_temp)
The chart below shows this simple raw metric, which reports points several times per minute. Near the end of the time window, no points are reported.

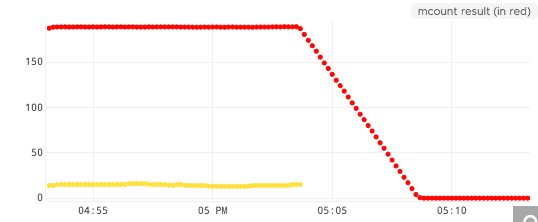
To see more clearly what’s happening, we can use mcount(). The chart below shows the results of the following query as red points:
mcount(5m,ts(vehicle.ambient_air_temp))

The query says: Show me points that represent the number of points that vehicle.ambient_air_temp reported in the last 5 minutes.
Notice how the red points are around 180 until the yellow points stop reporting. Then the red line drops slowly to 0 as fewer and fewer points reported vehicle.ambient_air_temp in the last 5 minutes. You can see that 2.5 minutes after the yellow line stops, the red line shows that 90 points were reported in the last 5 minutes.
Example 2
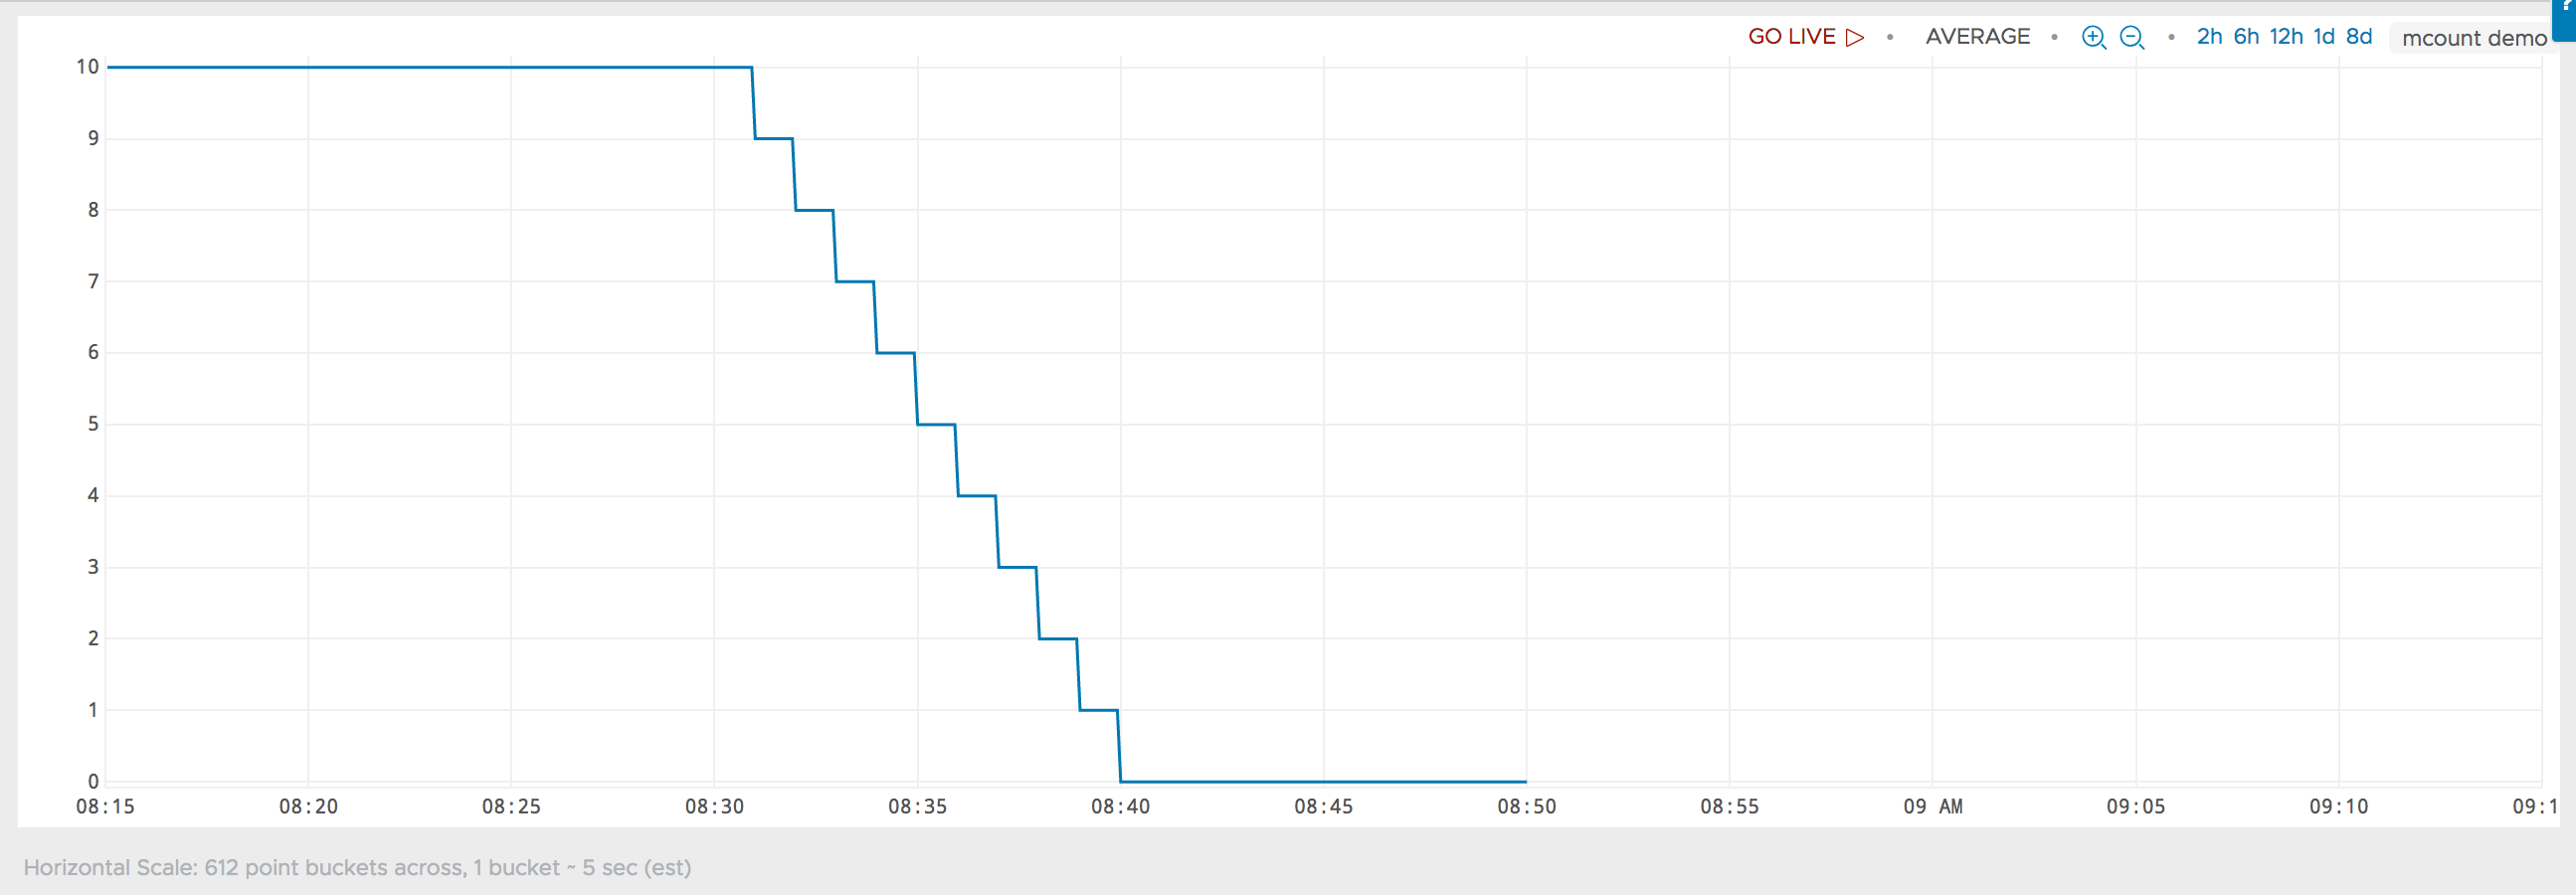
The chart below shows that, when my.metric stops reporting at 8:30, mcount(10m, my.metric) reports a decreasing value for 10 minutes until 8:40am, then a value of 0 for 10 more minutes, and then stops reporting at 8:50am.

Now consider what happens if my.metric starts reporting again at, say 9:01am. The chart below shows that mcount() picks up where it left off, by backfilling 0’s from 8:50am to 9:00am. mcount() includes these 0’s in the moving count, which rises with each successive minute that my.metric reports.

Note: In this example, my.metric started up 10 minutes after mcount() stopped reporting, but this interval could have been longer or shorter.