Reference to the mcorr() function
Summary
mcorr(<timeWindow>, <tsExpression1>, <tsExpression2> [,inner])
Returns the correlation between two time series, specified by tsExpression1 and tsExpression2, over the specified time window.
Parameters
| Parameter | Description |
|---|---|
| timeWindow | Amount of time in the moving time window. You can specify a time measurement based on the clock or calendar (1s, 1m, 1h, 1d, 1w), the window length (1vw) of the chart, or the bucket size (1bw) of the chart. Default is minutes if the unit is not specified. |
| tsExpression1 | Expression that describes the first set of time series to be correlated. |
| tsExpression2 | Expression that describes the second set of time series to be correlated. |
| inner | If the number of unique series associated with either expression is dynamic, then you can force series matching by adding the optional inner parameter. |
Description
The mcorr() function returns the moving correlation between pairs of time series specified by expression1 and expression2.
When you run the query, mcorr() compares expression1 to expression2 during the specified time window, and displays the correlation between the two expressions as a value between -1 and 1.
- Values at or close to 1 are total positive correlations.
- 0 is no correlation.
- Values at or close to -1 are total negative correlations.
mcorr() applies series matching between tsExpression1 and tsExpression2.
- If the two expressions have 2 or more unique series associated with them,
mcorr()evaluates only those unique series that appear in both expressions. - If there are no overlapping unique series,
mcorr()returns NO DATA. - If
tsExpression1ortsExpression2only have a single unique series associated with them, thenmcorr()correlates that single unique series with every unique series in the other expression. - If the number of unique series associated with either expression is dynamic, then you can force series matching by adding the optional
,innerparameter aftertsExpression2.
Examples
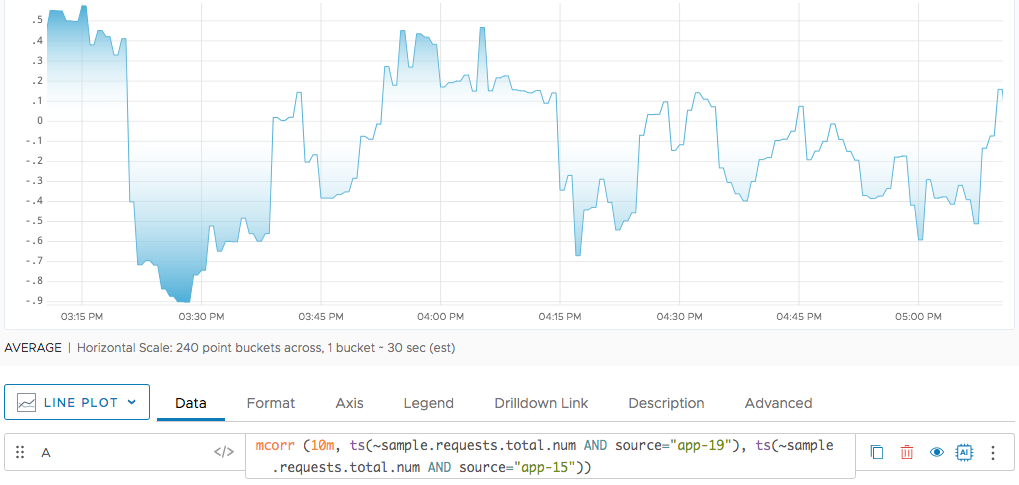
The following example shows the correlation between the total requests for app-19 and app-15 over a 10 minute time window.