Summary
frequencyHisto([<timeWindow>,] [<bucketName>,] <tsExpression>
   [,metrics|sources|sourceTags|pointTags|<pointTagKey>] )
Converts a histogram coming from Google Cloud Platform(GCP) to VMware Aria Operations for Applications (formerly known as Tanzu Observability by Wavefront) histogram format. When GCP Detailed Histogram Metrics is enabled, the query engine will additionally ingest bucket counts for GCP distributions, with metric namegcp.
Enabling GCP Detailed Histogram Metrics will increase your ingestion rate and cost.
Users can manipulate the resulting histograms with our histogram query functions.
Parameters
| Parameter | Description |
|---|---|
| timeWindow | Amount of time in the moving time window. You can specify a time measurement based on the clock or calendar (1s, 1m, 1h, 1d, 1w), the window length (1vw) of the chart, or the bucket size (1bw) of the chart. Defaults to 1m. |
| bucketName | Optional string that describes the bucket. Default is lt, that is, less than. If your source histogram uses a different tag key to specify the buckets, specify that tag key here. |
| tsExpression | Ordinary histogram distribution that we'll convert to an Operations for Applications histogram. |
| metrics|sources|sourceTags|pointTags|<pointTagKey> | Optional group by parameter for organizing the time series into subgroups and then returning each histogram subgroup.
Use one or more parameters to group by metric names, source names, source tag names, point tag names, values for a particular point tag key, or any combination of these items. Specify point tag keys by name. |
Description
This function converts ordinary histogram data to Operations for Applications histograms. Histogram data is defined as a set of time series where each series represents the frequency of outcomes in a particular bucket, bounded by a tag such as lt.
One use case is to visualize GCP distributions, which can be ingested by the Operations for Applications service using the Google Cloud Platform Integration. Distribution bucket data is ingested as gcp.<metric>.bucket with an lt tag defining the upper bound of each bucket. You can use frequencyHisto(ts(gcp.<metric>.bucket)) to convert the bucket data to an Operations for Applications histogram.
When a chart displays the result of this function, it shows the median by default. You can use percentile() to change that and, for example, show the 90% percentile.
The function generates a histogram by creating a T-digest and adding sampling points based on the range and the count of the bucket.
Grouping
Similar to aggregation functions for metrics, frequencyHisto() returns a single distribution per specified time window. To get separate distributions for groups that share common characteristics, you can include a group by parameter, as for many ts() queries. For example, use frequencyHisto(<expression>, sources) to group by sources.
The function returns a separate series of results for each group.
zone and ZONE, when you use an aggregation function and apply grouping, we consider zone and ZONE as separate tags. Interpolation
The frequencyHisto() function itself doesn’t perform interpolation because that doesn’t make sense for a histogram. But when you apply percentile(), we do perform interpolation.
See Standard Versus Raw Aggregation Functions.
Example
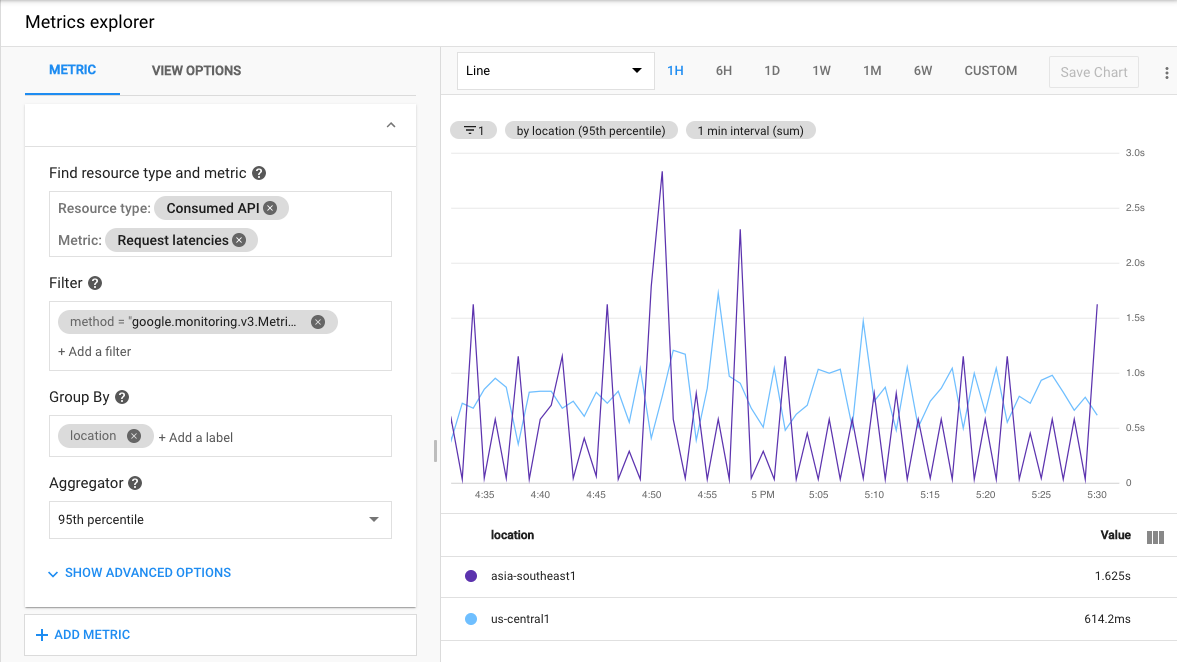
The following example shows how to visualize a Google Cloud Platform distribution. Let’s say that we have used the GCP Metrics Explorer to find the 95th percentile of a distribution, grouped by location.
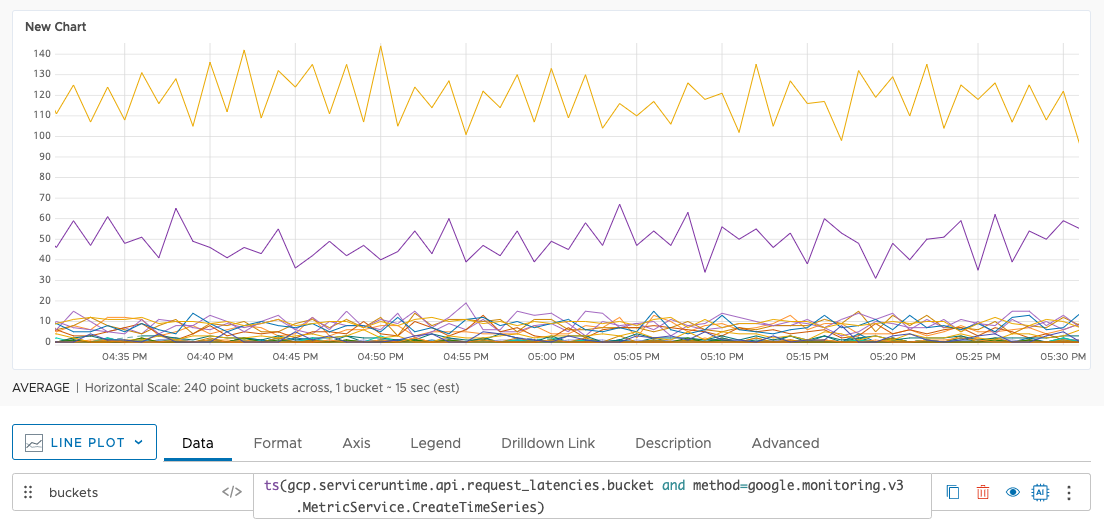
Now let’s do the same with WQL. The GCP integration ingests the distribution’s bucket data, so we can use ts() to visualize the bucket data.
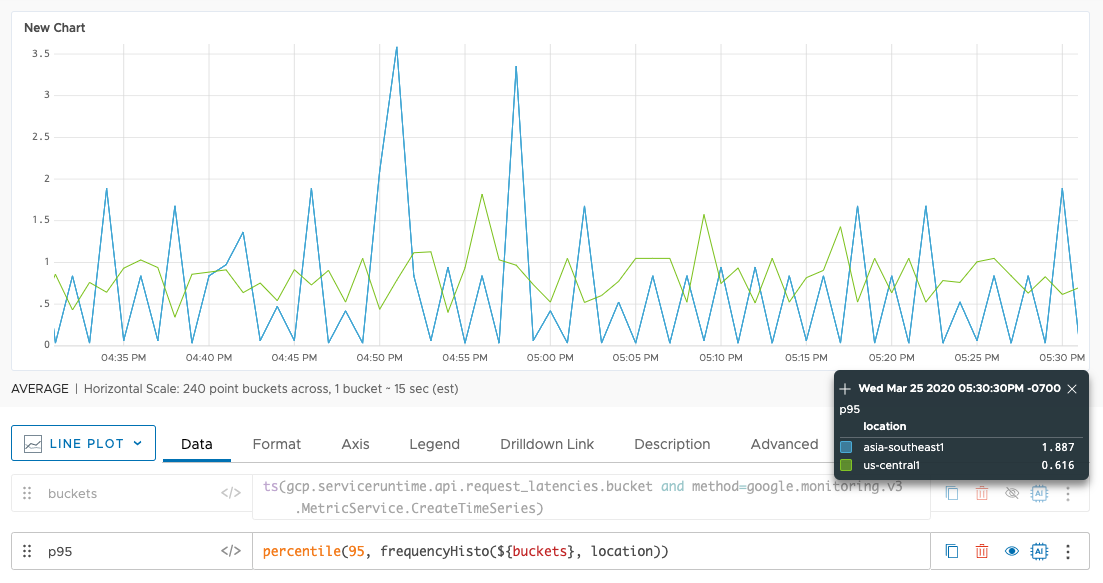
Then we use frequencyHisto() to convert the data to an Operations for Applications histogram and group by location, and finally, we use percentile() to find the 95th percentile of the histogram.
See Also
- Our histogram doc page gives background information about Operations for Applications histograms.
- The
cumulativeHisto()function is similar but converts Prometheus cumulative histograms to Operations for Applications ordinary histograms.
Caveats
This function is meant for original histograms, like those that come from Google Cloud Platform. It’s not useful for cumulative histogram distributions like those coming from Prometheus.